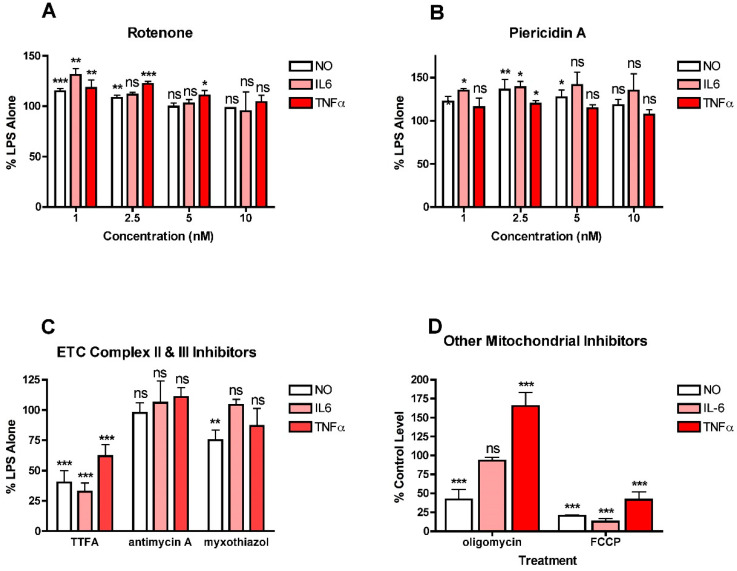
Figure 3.
Effects of mitochondrial inhibitors on NO and cytokine production in LPS-treated BV2 cells. BV2 cells were grown overnight in low-glucose medium and then transferred to high-glucose medium before treatment with 25 ng/mL LPS for 24 h. (A) Cells were treated with LPS alone or in the presence of the indicated concentrations of the complex I inhibitor rotenone. (B) Cells were treated with LPS alone or in the presence of the indicated concentrations of the complex I inhibitor piericidin A. (C) Cells were treated with LPS alone or in the presence of 10 µM of the complex II inhibitor TTFA or 5 nM of the complex III inhibitor antimycin A or 2.5 nM of the complex III inhibitor myxothiazol. (D) Cells were treated with LPS alone or in the presence of 10 µM of the ATP synthase inhibitor oligomycin or 10 µM of the mitochondrial uncoupler FCCP. The cell culture supernatants were assayed for NO, IL6 and TNFα production. The results are the average of a minimum of three independent experiments. * p < 0.05, ** p < 0.01, *** p < 0.001 as compared to LPS alone. ns, not significant.

