Figure 7.
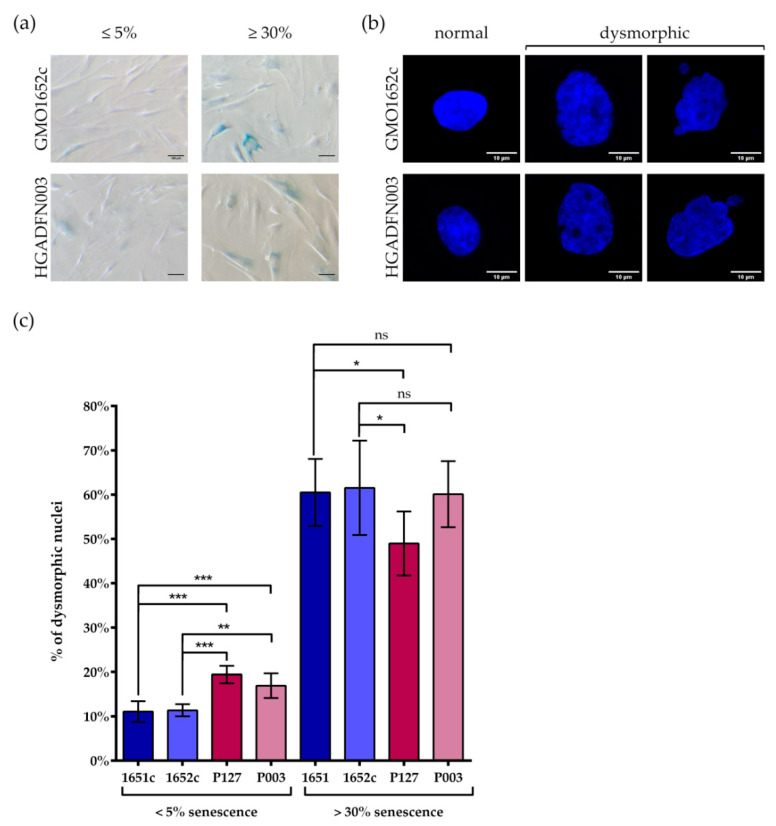
Number of dysmorphic nuclei increased with replicative senescence in both control and HGPS. (a) Representative images of SA-β-galactosidase stained cells. (b) Representative images of normal and dysmorphic nuclei counterstained with DAPI. (c) The number of dysmorphic cells in <5% and >30% control and HGPS fibroblasts, was determined by counting nuclei counterstained with DAPI. Comparisons within control or HGPS cell lines, with similar senescence, are not significant. At 5% senescence, HGPS passage numbers were ≤P18, control cells were ≤P21. At 30% senescence, control passages were ≥P25, HGPS were ≥P21. Values are presented as mean ± SD (n ≥ 3), not significant (ns) p > 0.05, * p < 0.05, ** p < 0.01, *** p < 001, one-way ANOVA with Tukey’s multiple comparison test.

