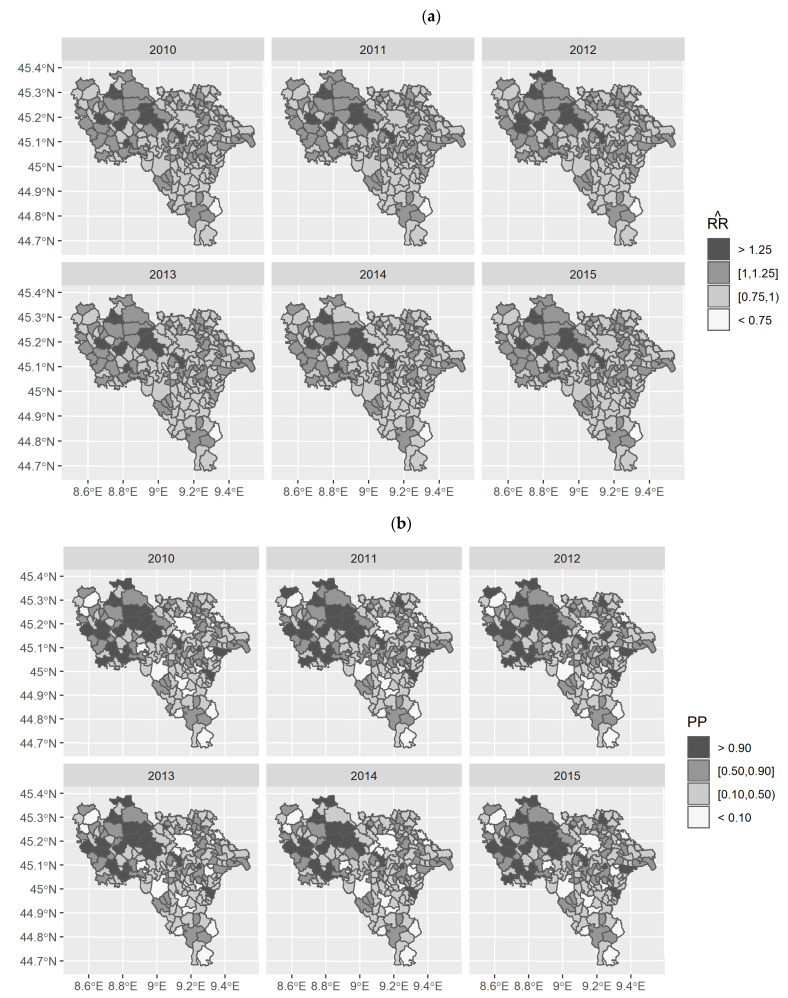
Figure 5.
Spatio-temporal distribution of relative risk (RR) estimates provided by the Log-linear with spatially unstructured random intercept and posterior probabilities (PP). (a) RR estimates are “temporally” smoothed by the random intercepts posed on each municipality during the study period. Darker municipalities have a higher RR estimate, while those with whiter colours show a smaller risk estimate given by the marginal posterior distribution of RR for each area. (b) PP are calculated as . Areas marked with a darker colour are more likely to be high-risk municipalities; conversely, areas marked with a whiter colour are likely to show a smaller risk.

