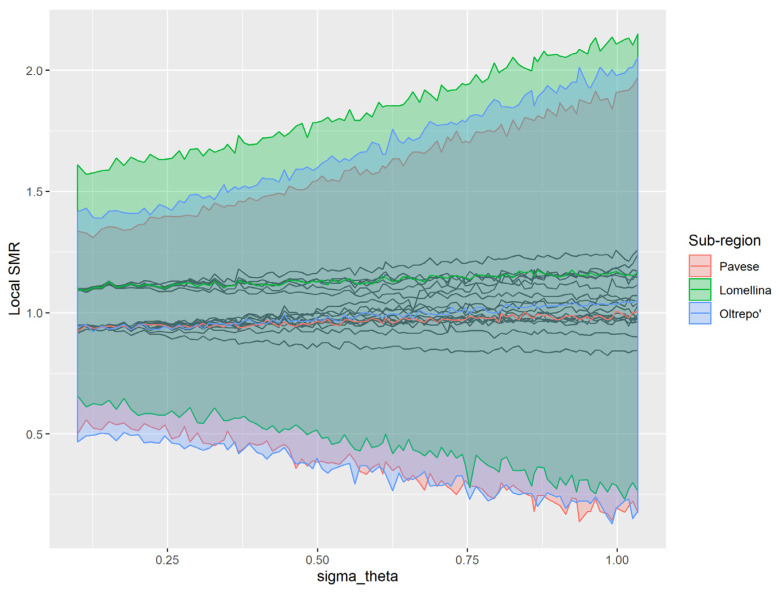
Figure A1.
Graphical representation of the hierarchical model to compare sub-regions’ overall means with varying the standard deviation between global means Bayesian hierarchical model with 100 different hyperpriors’ specifications of variance parameters of the subareas’ mean (scaled inverse chi-squared distributions with 10 degrees of freedom and scales varying between 0.1 and 1.5, using as input the year-subareas mean) was applied. The local subareas’ estimated mean of Lomellina seemed to have different values of standardised mortality ratio (SMR) with respect to other subareas, but this difference was not significant given that the 1-PP (PP = posterior probability) values (corrected with Bonferroni’s correction) were smaller than 0.95 in the difference (.

