Figure 3.
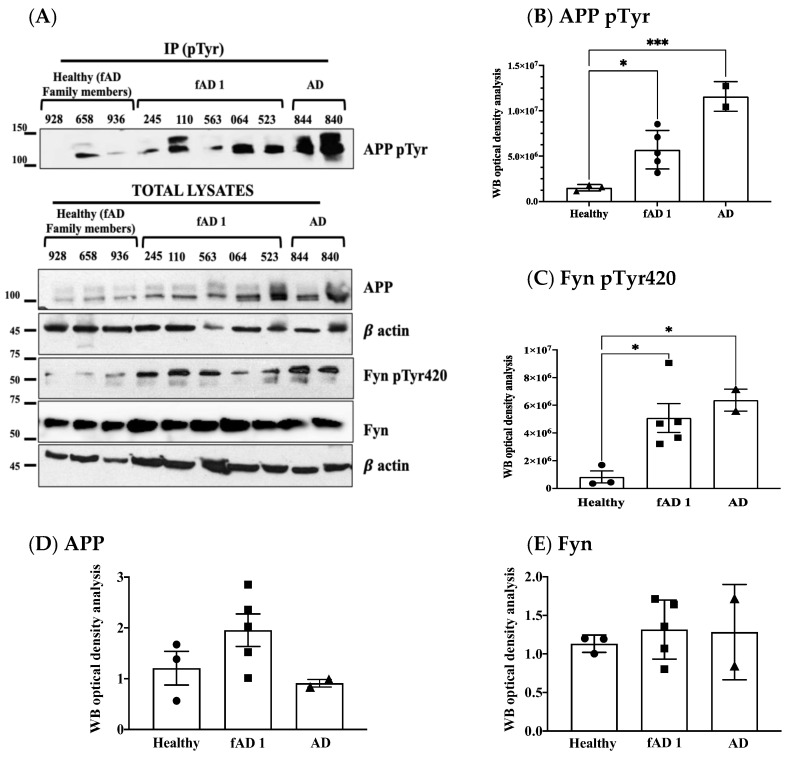
APP Tyr phosphorylation increases in fibroblasts from familial AD type 1 (fAD 1) and AD patients compared to healthy controls with a history of fAD 1. Panel (A) shows WB analyses of APP pTyr, Fyn pTyr420, APP and Fyn in healthy donors (circle) patients with a diagnosis of fAD 1 (square) and AD (triangle). Panels (B–E) report the densitometric analyses of the bands shown in panel (A). In particular, panel (B) reports the optical density analysis of APP pTyr bands expressed as the mean optical density ratio between APP pTyr and APP basal levels from each sample. * p < 0.05; *** p < 0.001. Panel (C) reports the ratio of FynpTyr420 relative to basal Fyn levels. * p < 0.05, one-way ANOVA followed by Tukey’s test. APP and Fyn expression levels, normalised on β-actin values, are reported in panels (D,E).

