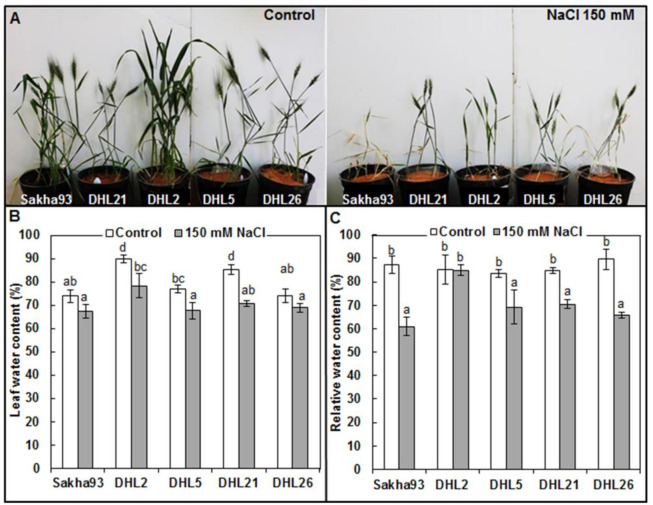
Figure 1.
Assessment of salt stress tolerance of five wheat genotypes. (A) Phenotype of the five wheat genotypes at the floret initiation stage grown under normal and salt stress conditions. (B) Leaf water content. (C) Relative water content. Values are presented as the mean ± SE of at least three replications, and values sharing the same letter for each treatment × genotype combination are not significantly different (p ≤ 0.05) according to Duncan’s multiple range test.

