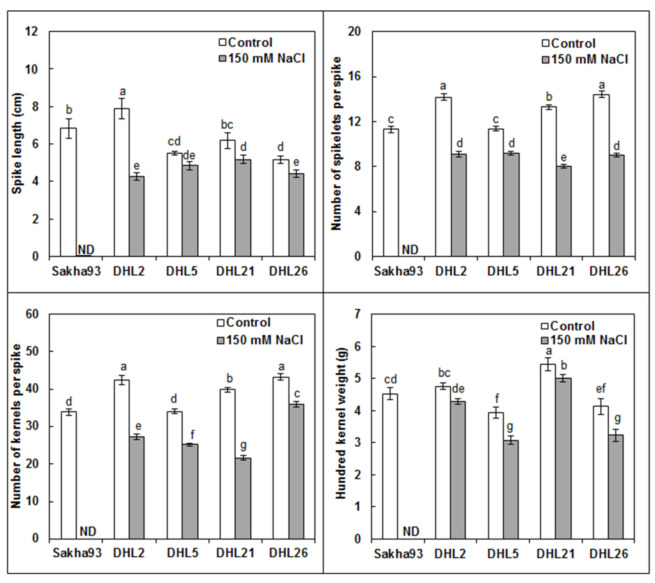
Figure 8.
Effects of salinity on yield parameters (spike length, spikelet number, kernel number, and 100-kernel weight) of five wheat genotypes. Values are presented as the mean ± SE of at least three replications, and values sharing the same letter for each treatment × genotype combination are not significantly different (p ≤ 0.05) according to Duncan’s multiple range test.

