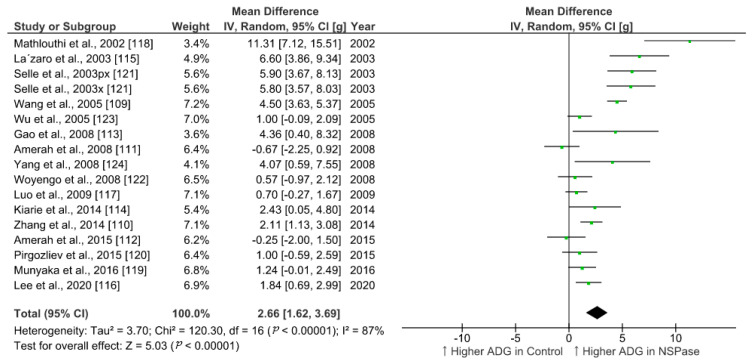
Figure 1.
Forest plot of comparison: Effect of non-starch polysaccharides-degrading enzymes on average daily gain (g/day) of broilers fed either wheat or barley or rye-based diets during a trial duration of 20–25 days. Abbreviations: ADG: average daily gain; px: phytase + xylanase; x: xylanase; IV: inverse-variance; CI: confidence interval; Tau2: tau-squared; Chi2: chi-squared; df: degrees of freedom; I2: I-squared statistic; Z: Z-test statistic. The vertical line corresponding to the value of zero (0) in the plot is the line of no effect. The hyphen (-) represents a negative mean difference (effect size) and corresponds to a higher average daily gain in control compared with NSPase group. The squared green boxes represent the point estimates and the width of the horizontal lines extending from the squared green boxes represent the 95% confidence interval of the individual study. The mid-point of the green boxes represents the mean effect estimate and the area of the boxes represent the corresponding weight given to each study. The diamond at the bottom of the studies represents the summary estimate and confidence interval of all studies combined. The points on the vertical axis of the diamond represents the overall effect and the width of the diamond represents the 95% confidence interval. The upward arrow in the label of the plot visually represents a higher average daily gain.

