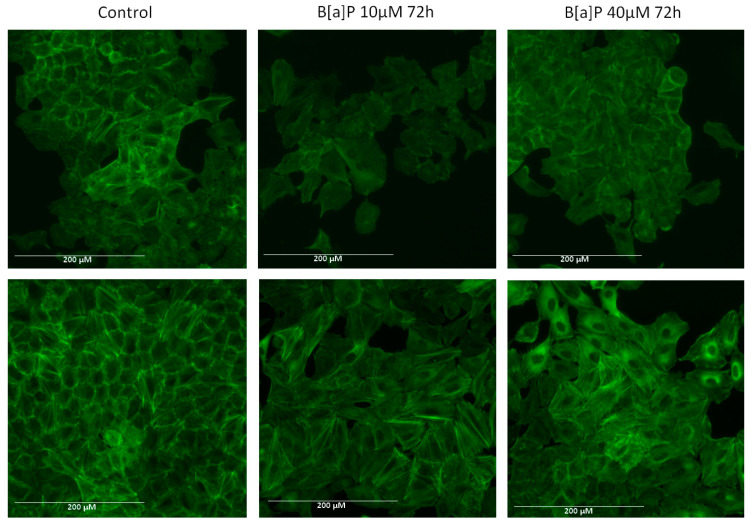
Figure 3.
Fluorescence microscopic changes in F-actin cytoskeleton organization in A549 cell line. After B[a]P incubation, the cells were stained using ActinGreen 488 ReadyProbes®. The data shown are representative of three independent experiments. The images were captured under the same acquisition parameters by EVOS FL fluorescence microscope (Thermo Fisher Scientific). Upper panels: cells incubated in the absence of the brown algae extract, lower panels: cells incubated in the presence of the brown algae extract.

