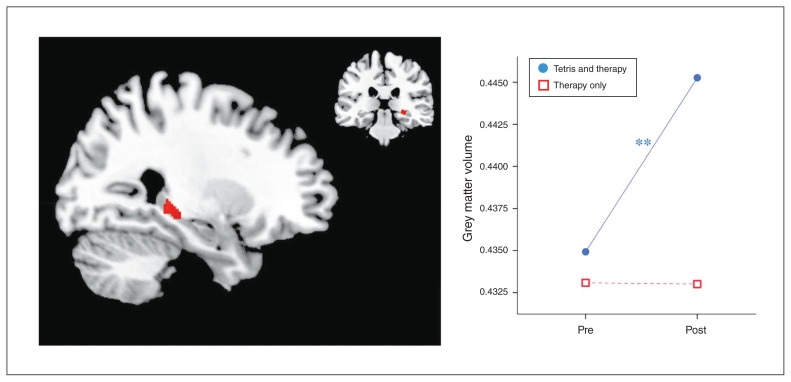
Fig. 1.
Neuroimaging results of whole-brain analysis. Brain image displays the cluster from a whole-brain analysis across all participants, comparing increases in the Tetris group to the therapy-only control group after treatment (k = 150; x = 27, y = −33, z = −3; p < 0.001 at the voxel level, and k > 100, non-isotropic smoothness corrected at the cluster level). Post = directly after therapy; pre = before therapy.

