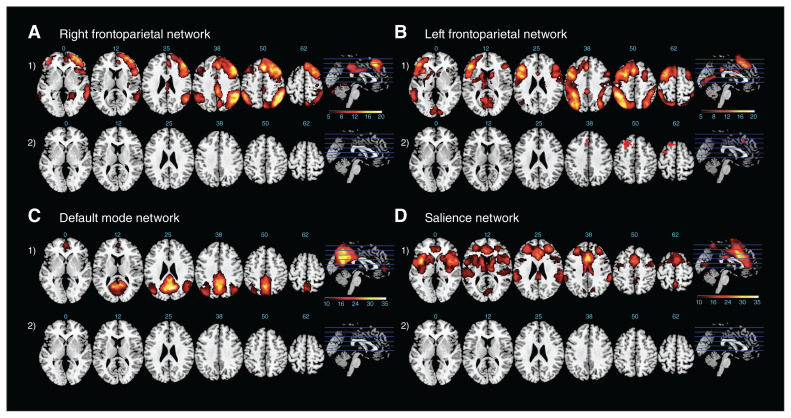
Fig. 1.
Right and left frontoparietal network, default mode network and salience network overlaid on a Montreal Neurological Institute template. Axial slices of each network are at the following ascending z coordinates: 0, 12, 25, 38, 50 and 62. (1) Results for 1-sample t tests of the respective network for all participants (pFWE < 0.05). The colour scale for the right and left frontoparietal networks is shown for t values. (2) Results for the 2-sample t test between groups (healthy controls and patients with obsessive–compulsive disorder; OCD). Red highlights the changes for patients with OCD > healthy controls. The colour scale represents t values, and all maps are corrected with the extent threshold (p < 0.001; cluster > 111). FWE = family-wise error.

