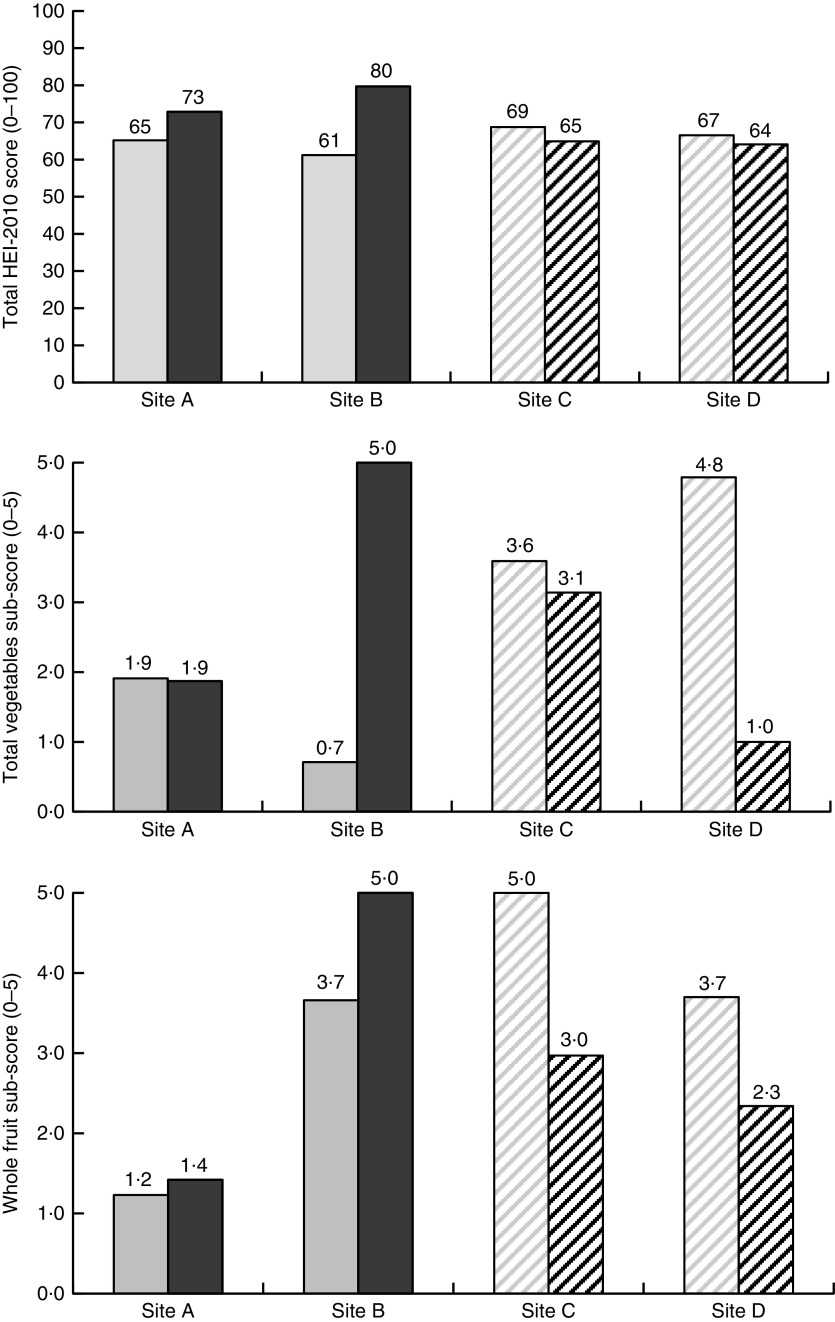
Fig. 2.
Food pantry inventory total Healthy Eating Index-2010 (HEI-2010) and seasonal HEI-2010 sub-component changes from baseline ( ,
,
 ) to follow-up (
 ,
,  ) in intervention sites (A and B;
  ,
,  ) and control sites (C and D;
  ,
,  ); pilot study of the SuperShelf intervention implemented in four food pantries in the greater Minneapolis–St. Paul, MN metropolitan area, USA, 2017

