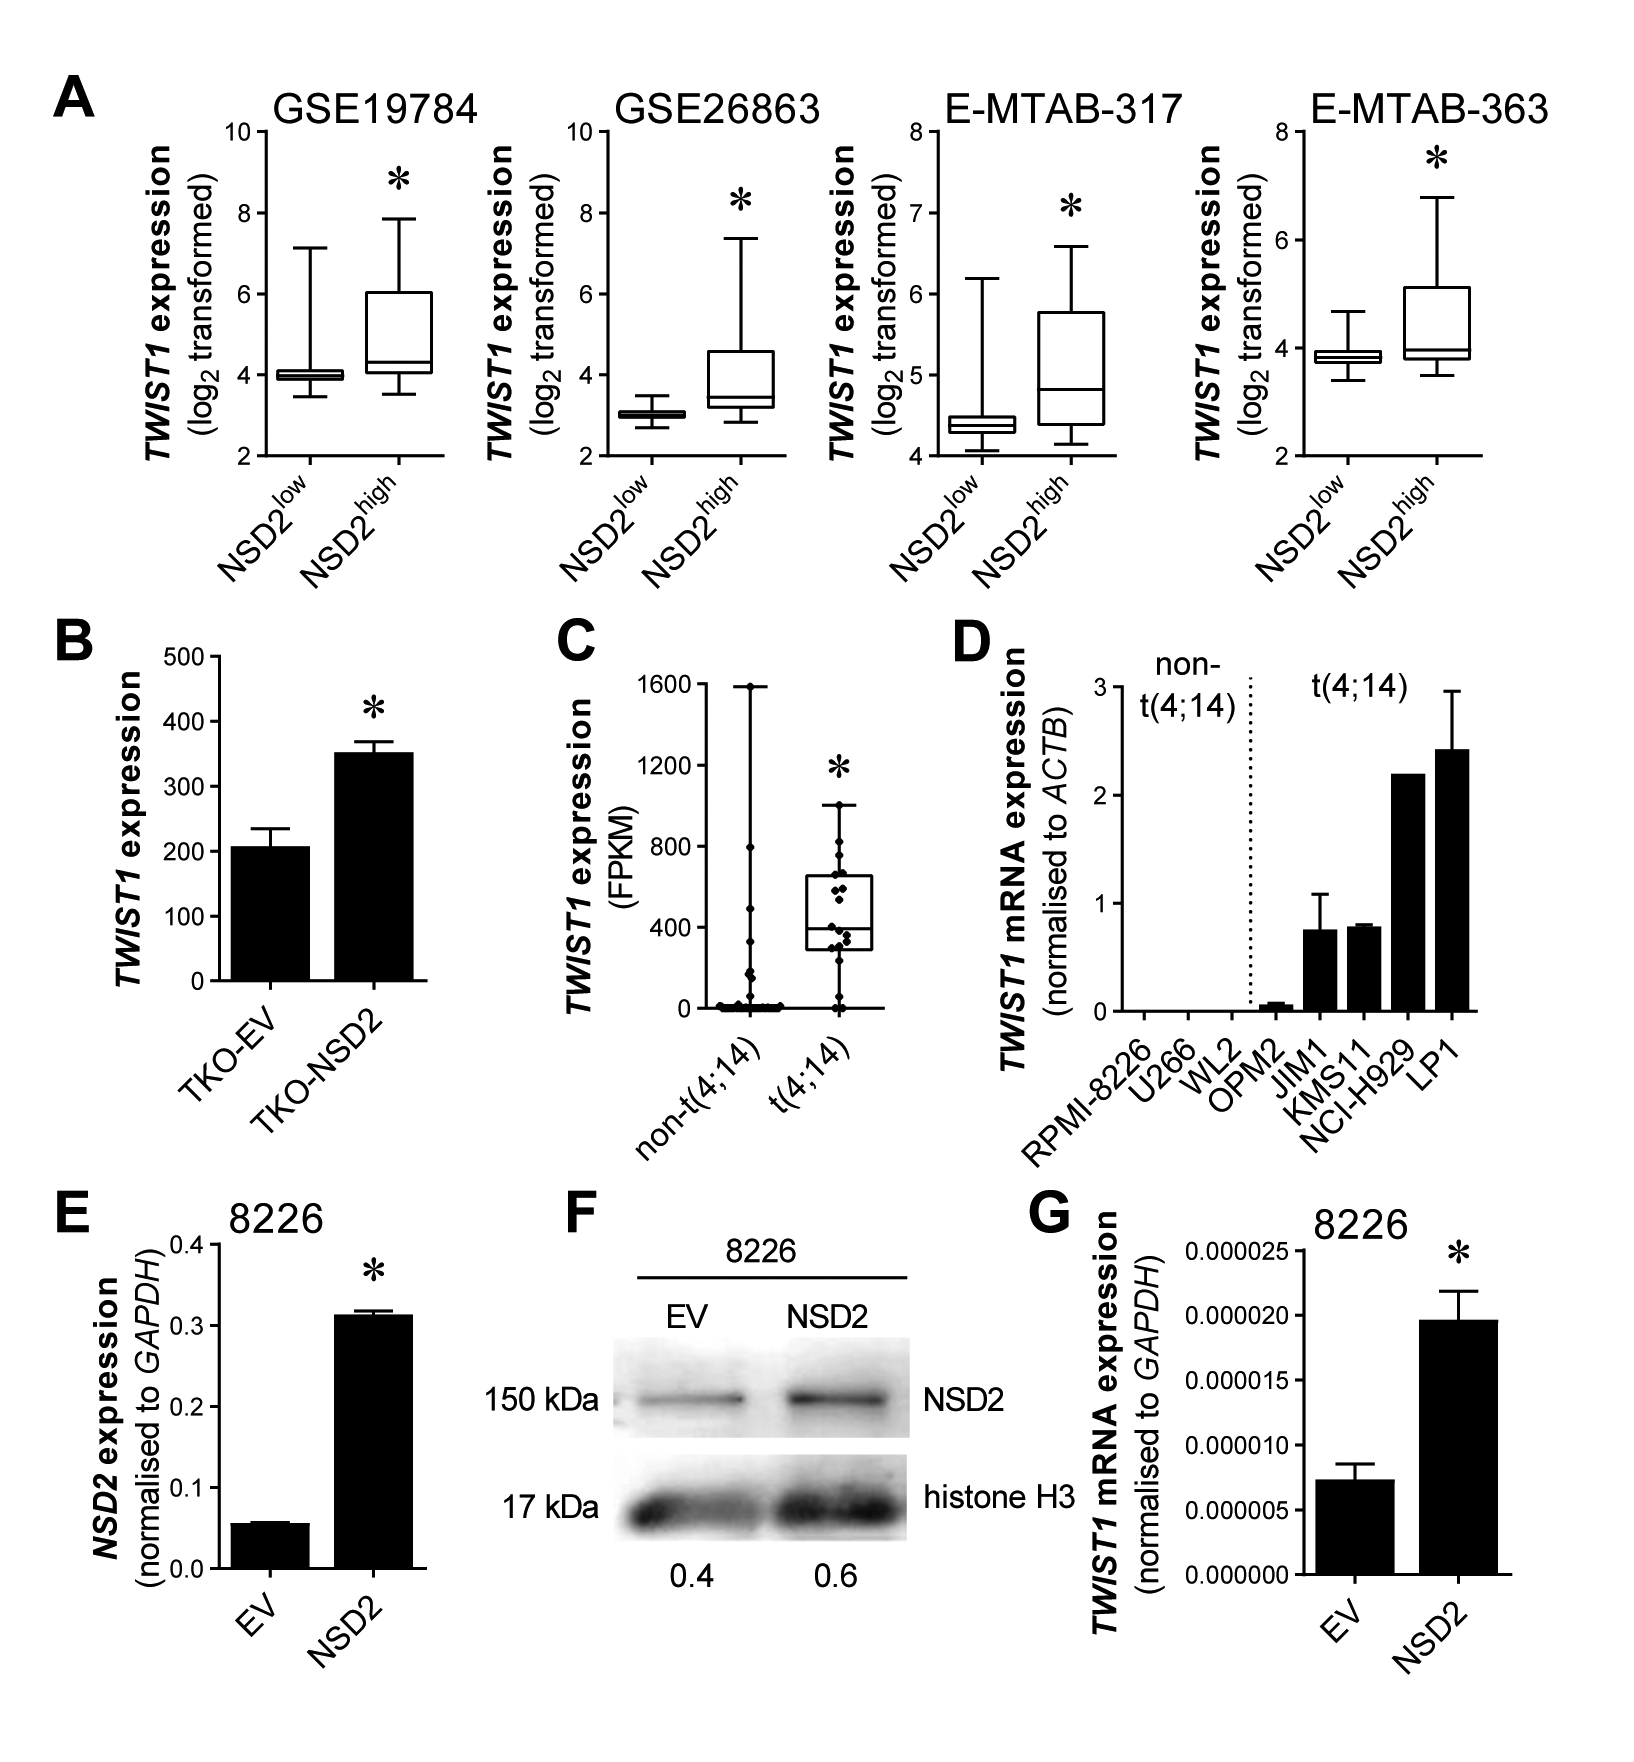
Figure 2. TWIST1 expression is upregulated by NSD2 in MM.

TWIST1 expression, as determined by microarray, was assessed in CD138-selected BM PCs from NSD2low and NSD2high MM patients (A). Upregulation of TWIST1 expression with NSD2 overexpression is shown in KMS11-TKO-NSD2 cells compared with control cells (KMS11-TKO-EV), as assessed by microarray (B). Expression of TWIST1 in t(4;14)-positive and non-t(4;14) MM cell lines was assessed in a publicly available RNAseq dataset (C) and by qRT-PCR in a panel of human B-cell and MM cell lines (D). The non-t(4;14) MM cell line RPMI-8226 was retrovirally transduced to constitutively overexpress NSD2 and NSD2 expression, normalised to GAPDH, was assessed by qRT-PCR (E). Upregulation of NSD2 protein in RPMI-8226-NSD2 cells, relative to RPMI-8226-EV cells, was confirmed by Western blotting on nuclear lysates, run on 10% SDS-PAGE gels, using histone H3 as a loading control. Numerical values indicate NSD2 protein levels relative to histone H3 protein levels (F). Relative TWIST1 mRNA expression, normalised to GAPDH, was measured by qRT-PCR in RPMI-8226-EV and RPMI-8226-NSD2 cell lines (G). Graphs depict the median and interquartile ranges (GSE19784 [NSD2low, n = 288; NSD2high, n = 40], GSE26863 [NSD2low, n = 270; NSD2high, n = 34], E-MTAB-317 [NSD2low, n = 192; NSD2high, n = 34], E-MTAB-363 [NSD2low, n = 128; NSD2high, n = 27], A; t(4;14), n = 18; non-t(4;14), n = 48; C) or mean + SEM of three independent biological replicates (B, D, E, G). * p < 0.05 (LIMMA [A, C] or unpaired t-test [B, E, G]).
