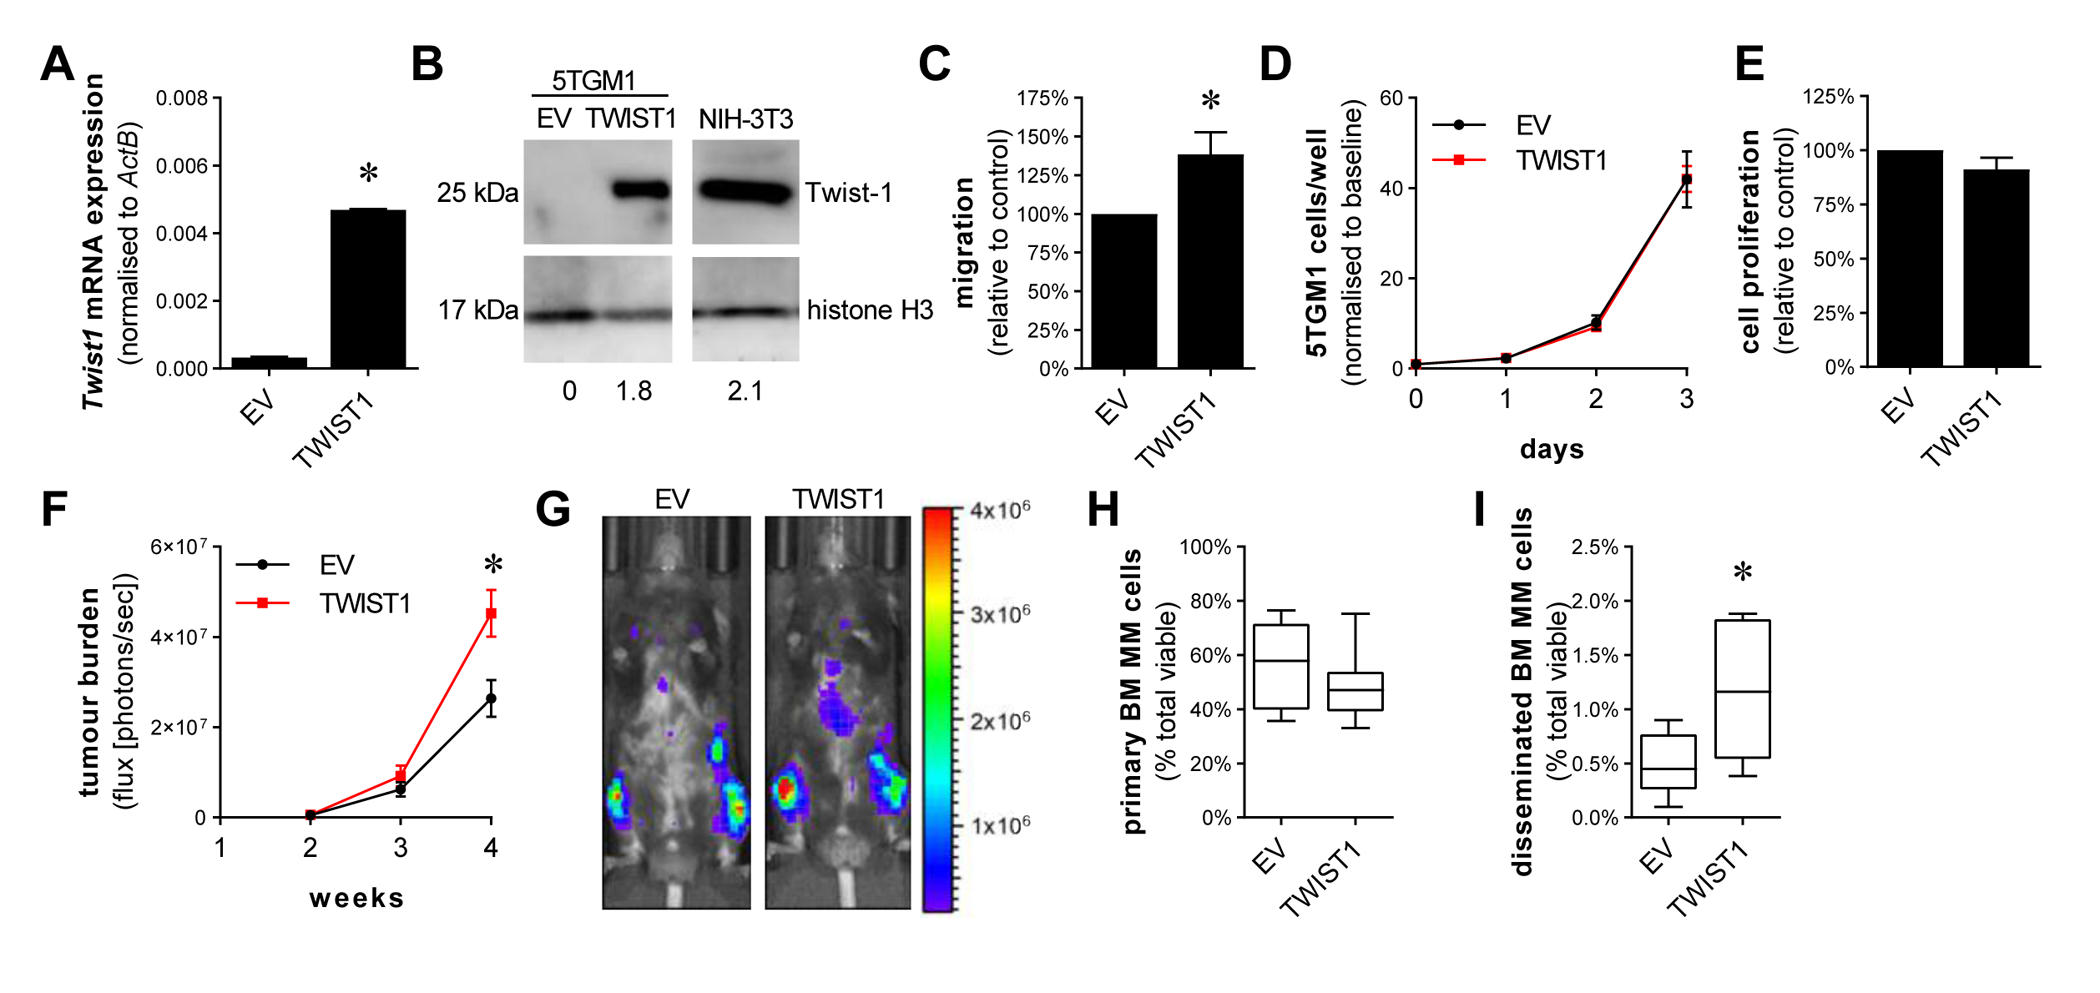
Figure 4. Twist-1 overexpression in the murine MM cell line 5TGM1 increases cell migration in vitro and tumour dissemination in vivo.

5TGM1 cells were lentivirally transduced with a Twist1 expression vector or empty vector (EV) control and Twist1 expression, normalised to ActB was assessed by qRT-PCR (A). Overexpression of Twist-1 protein in 5TGM1-TWIST1 cells was validated by Western blot on nuclear protein extracts of 5TGM1-EV, 5TGM1-TWIST1 and positive control NIH-3T3 cells, resolved on 12% SDS-PAGE gels and immunoblotted with anti-Twist-1 and anti-histone H3 antibodies. Numerical values indicate Twist-1 protein levels relative to histone H3 protein levels (B). Trans-endothelial migration of 5TGM1-Twist1 and 5TGM1-EV controls cells (1×10⁵ cells/well) in response to FCS gradient was assessed in a trans-well assay (C). Proliferation of 5TGM1-Twist1 and 5TGM1-EV controls cells was assessed by WST-1, normalised to day 0 (D), or by BrdU assay, normalised to EV controls (E). C57BL/KalwRij mice were intravenously injected with 5×10⁵ 5TGM1-EV or 5TGM1-TWIST1 cells. Total body tumour burden was assessed using bioluminescence imaging at 2, 3 and 4 weeks (F). Bioluminescence images of a representative mouse from each group at week 4 are shown (G). The left tibiae of C57BL/KalwRij mice were injected with either 1×10⁵ 5TGM1-EV or 1×10⁵ 5TGM1-TWIST1 cells. After 3.5 weeks, tumour burden in the injected tibia (H) and in the contralateral tibia and femur (I) was assessed by detection of GFP+ tumour cells by flow cytometry, shown as a percentage of total mononuclear cells. Graphs depict mean ± SEM of three (A, D-E) or five (C) independent experiments, mean ± SEM of 8–10 mice/group (F) or median and interquartile range of 7–11 mice/group (H, I). * p < 0.05, unpaired t-test (A, C), two-way ANOVA with Sidak’s multiple comparison test (F) or Mann-Whitney test (H, I).
