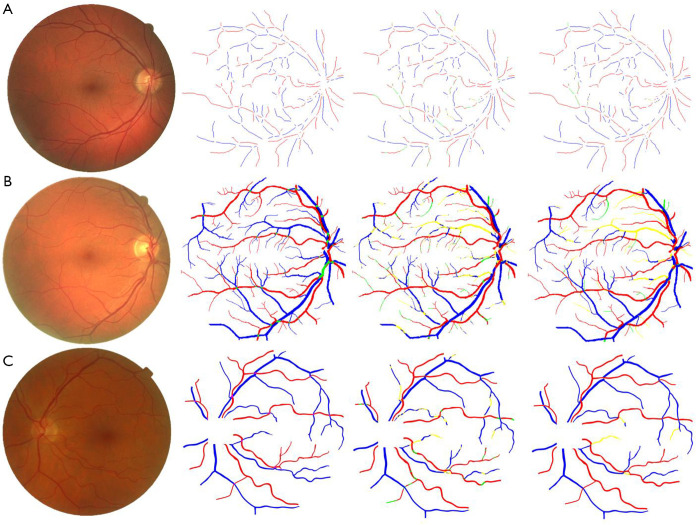
Figure 4.
Classification results on publicly available databases. First column: original fundus image; second column: ground truth (blue pixels: veins, red: arteries, green: unknown); third column: CNN classification (yellow pixels: false positive, green: false negative); fourth column: final classification after the LSP step. (A) Image from CT-DRIVE (CNN: 88.3%, CNN + LSP: 95.4%); (B) image from ALL-DRIVE (CNN: 81.7%, CNN + LSP: 86.0%); (C) image from MESSIDOR (CNN: 90.9%, CNN + LSP: 96.6%). Reprinted with permission from (99).

