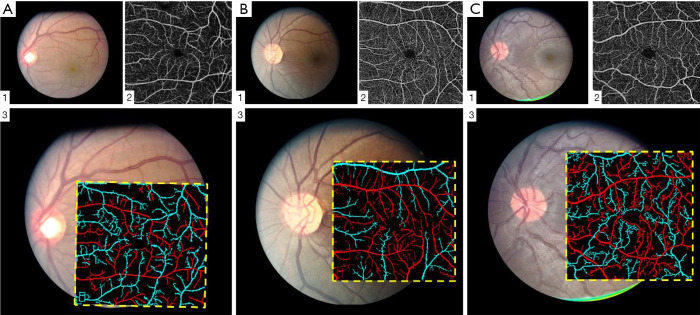
Figure 6.
Representative artery-vein classification results from control (A), mild SCR (B), and severe SCR (C) groups. (A1,B1,C1) Fundus image; (A2,B2,C2) OCTA image; (A3,B3,C3) OCTA artery-vein maps overlaid on corresponding fundus images. Reprinted from Ref. (24).

