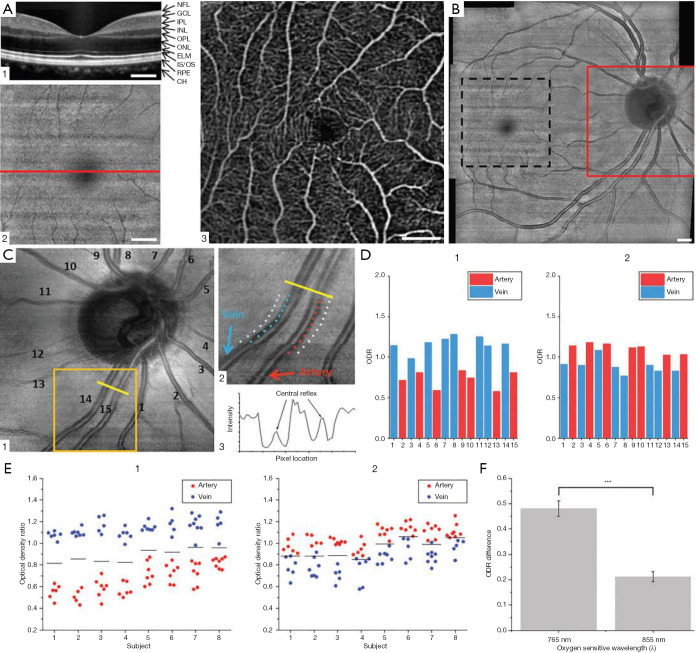
Figure 9.
Representative B-scan OCT (A1), en face OCT (A2), and OCTA (A3) images from the macula. The horizontal line in (a2) indicates the location of B-scan OCT in (A1). (B) OCT fundus covering optic disc and macular regions. En face OCT from optic disc (C1), sampling locations of vessels and tissue area (C2), intensity profile over vessels and tissue (C3). ODRs from vessels in (C1) at 765 nm (D1) and 855 nm (D2). ODRs from each subject with 765/805 nm analysis (E1) and 805/855 nm analysis (E2). Solid black lines indicate averaged ODR of all artery and vein ODRs for each subject. (F) Averaged ODR difference of artery and vein from different oxygen-sensitive wavelength. Scale bars: 500 mm. Re-printed from Ref. (107).

