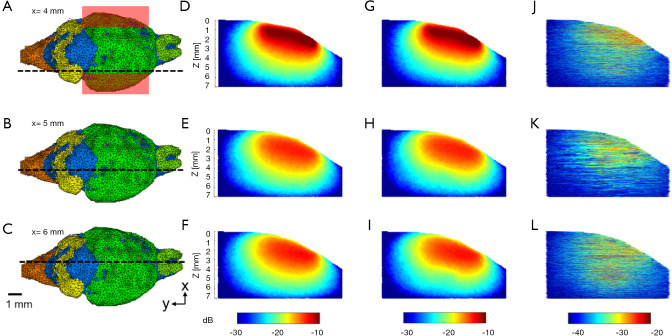
Figure 5.
Optical fluence distribution maps of representative sagittal planes in 3D MC models with and without blood vessels, simulated at 1,064 nm. Locations of illumination are indicated by red rectangular boxes in (A). (A-C) Black dashed lines indicate the locations of the sagittal planes. (D-F) Normalized optical fluence maps without blood vessels shown in decibel scale. (G-I) Optical fluence maps with blood vessels. (J-L) Optical fluence difference between (D-F) and (G-I). MC, Monte Carlo.

