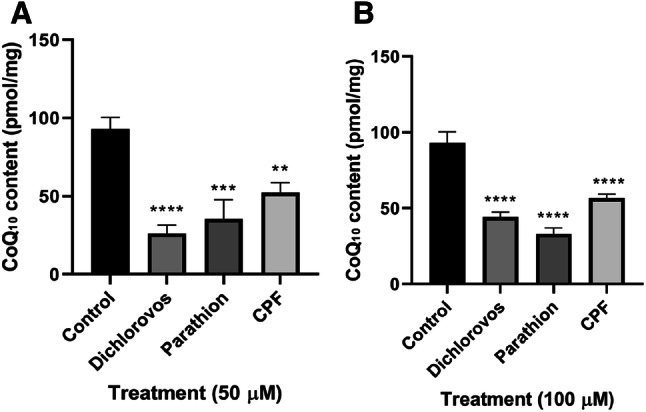
Fig. 3.

Effect of 5 day treatments of OPs dichlorvos, parathion and CPF on CoQ10 content (pmol/mg) in SH-SY5Y cells. a 50 µM concentration of OPs (n = 3), b 100 µM concentration of OPs (n = 3). Error bars represent standard deviation; statistical analysis was carried out using one-way ANOVA with Tukey’s multiple comparison post hoc test; levels of significance: *p < 0.05, **p < 0.005, ***p < 0.0005, ****p < 0.0001 compared to control levels
