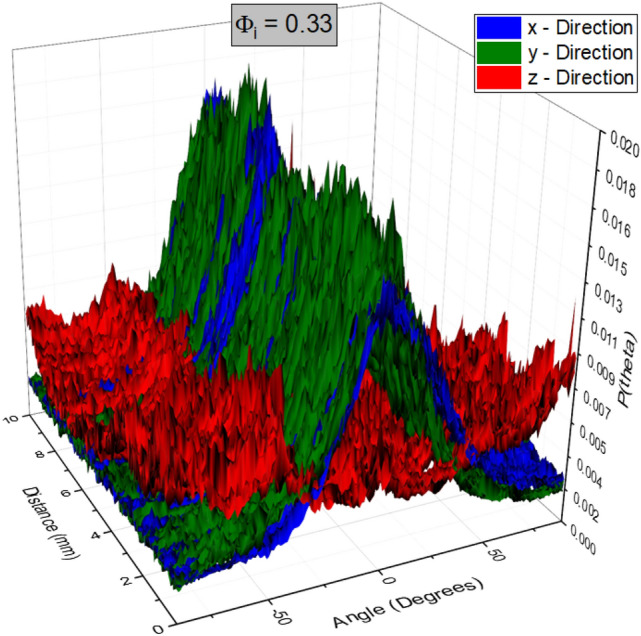
Fig. 10.

Fibre orientation distributions for the sample made from a fibre-foam dispersion with . The angle in degrees, ranging from to is shown on the x-axis, distance (depth within the sample) is shown on the y-axis. The normalised counts are represented on the z-axis. The distributions from the x and y directions (blue and green data sets) are seen to have one dominant peak through the sample located at angle zero, indicating the layering of fibres along the horizontal perpendicular to gravity. No dominant direction is revealed when probing from the z-direction (red data set)
