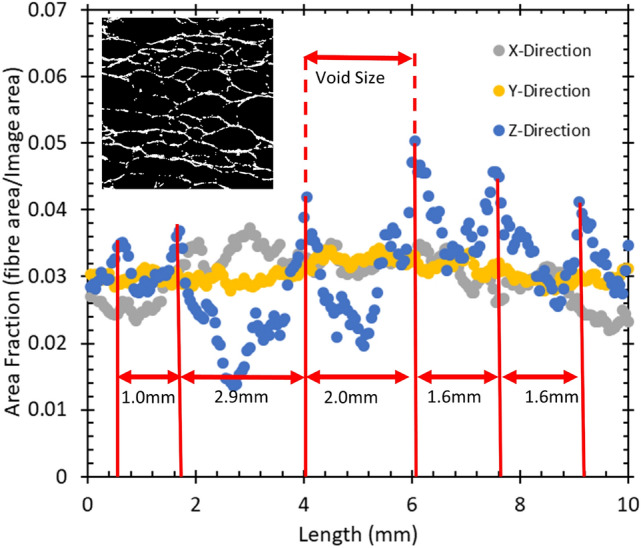
Fig. 4.

Density profiles of one of our foam-formed fibrous materials. Plotted is the fibre area fraction as a function of distance through the sample in mm. The x and y-directions display an approximately uniform density profile throughout the sample. The variations in the z-direction indicates layering of the fibres (see Sect. 4). The majority of the fibres is in the xy-plane (horizontal) with the remainder of the fibres supporting these layers. The inset shows a binarized image of a vertical sample slice
