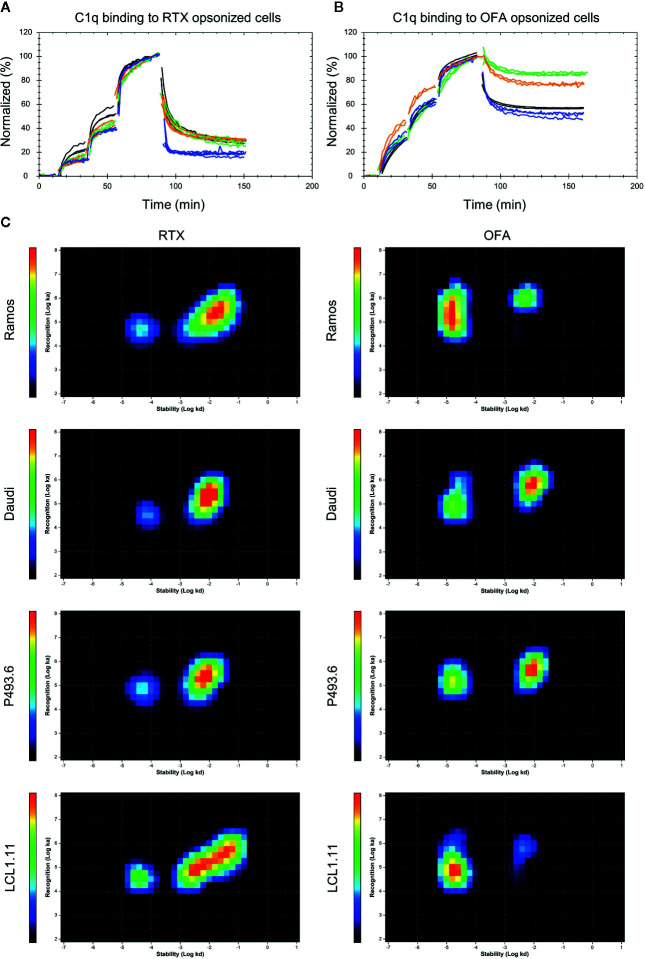
Figure 4.
Binding of C1q to antibody opsonized B cells. Binding of fluorescent C1q to mAb opsonized Ramos (orange), Daudi (blue), P493.6 (black) and LCL1.11 cells (green) at concentrations of 1.4 nM, 3.9 nM, and 9.6 nM followed by dissociation. Cells were pre-incubated with either 60 nM unlabeled Rituximab (RTX) (A) or Ofatumumab (OFA) (B) for 1 h at room temperature prior to C1q binding and the antibody concentration was kept constant during the entire experiment. (C) InteractionMap for C1q binding to mAb opsonized cells. InteractionMap (IM) is an on/off-plot with each pixel representing a unique ka/kd combination and heat-map coloration indicating how much each combination is contributing to the interaction analyzed. Per cell line n=3–4 replicates were calculated into one IM.

