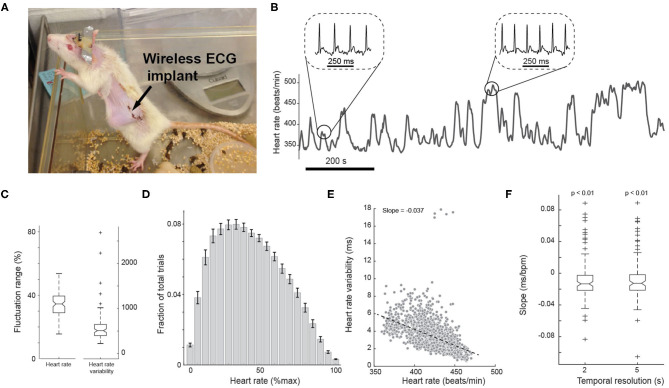
Figure 2.
Measurement of ECG from a wireless implant in awake animals. (A) Photo of a rat with a wireless electrocardiogram (ECG) implant. (B) Representative heart rate fluctuation throughout behavioral tasks. Insets: ECG traces during low and high heart rate periods. (C) Boxplots of fluctuation range of heart rate and heart rate variability across all sessions. (D) Histogram of heart rate. Error bars indicate SEM. (E) Negative correlation between heart rate and heart rate variability of an example session. n = 1,148 segments. (F) Box plots of the slope of correlation between heart rate and heart rate variability across all sessions.

