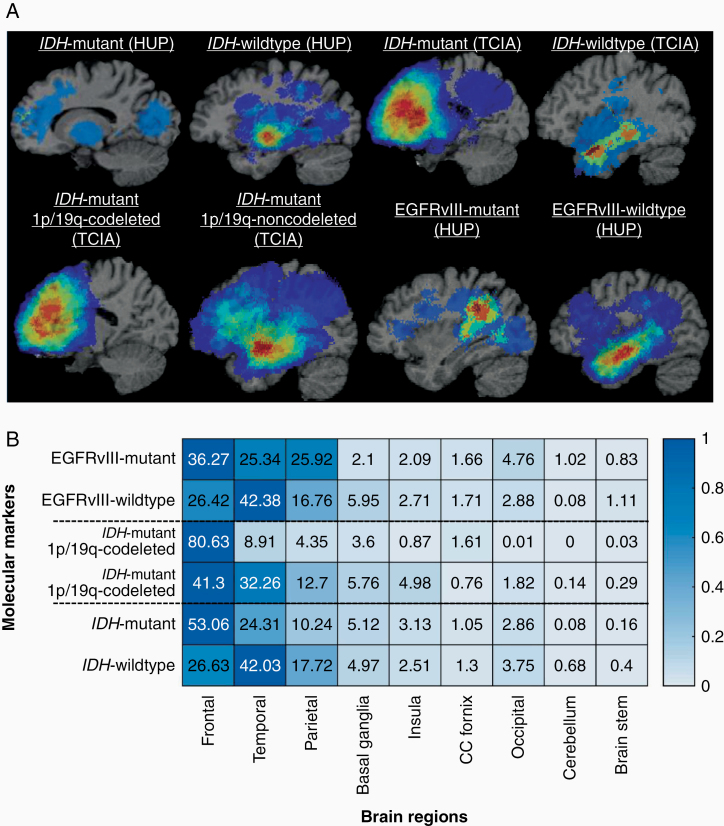
Figure 4.
(A) Atlases representing distribution of tumors by IDH, EGFRvIII, and 1p/19q codeletion status. All images were displayed in the radiological convention orientation. (B) Percentage distribution of tumors in 9 brain regions by IDH, EGFRvIII, and 1p/19q codeletion status. Distributions were combined for IDH cases of HUP and TCIA.

