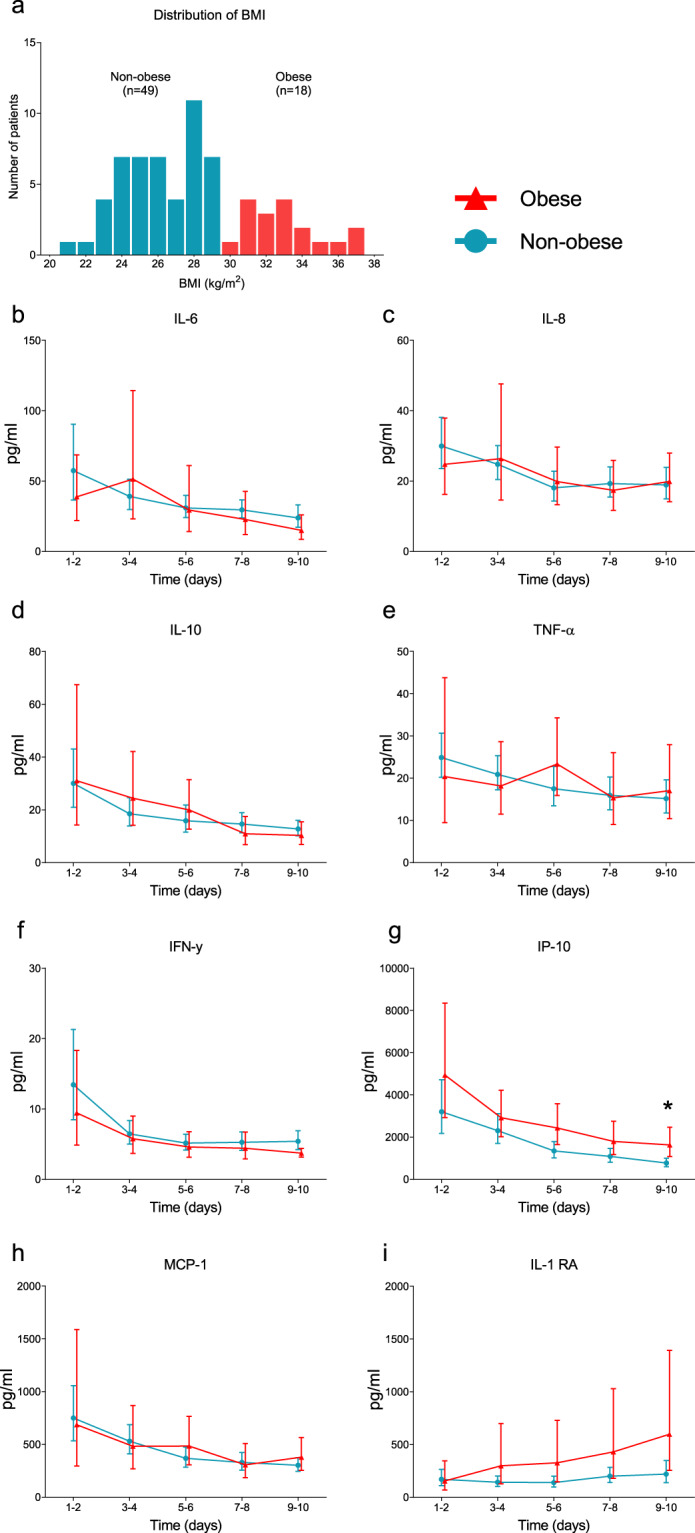
Fig. 1. Body mass index distribution and plasma cytokine levels.

a Histogram depicting body mass index (BMI) frequencies. Kinetics of concentrations of circulating b interleukin (IL)-6, c IL-8, d IL-10, e tumor necrosis factor alpha (TNF-α), f interferon gamma (IFN-γ), g interferon gamma-induced protein (IP)-10, h monocyte chemoattractant protein (MCP)-1 and i IL-1 receptor antagonist (RA). Data are presented as geometric mean with 95% confidence interval. *p < 0.05, calculated using Sidak’s post-hoc multiple comparisons tests on individual timepoints.
