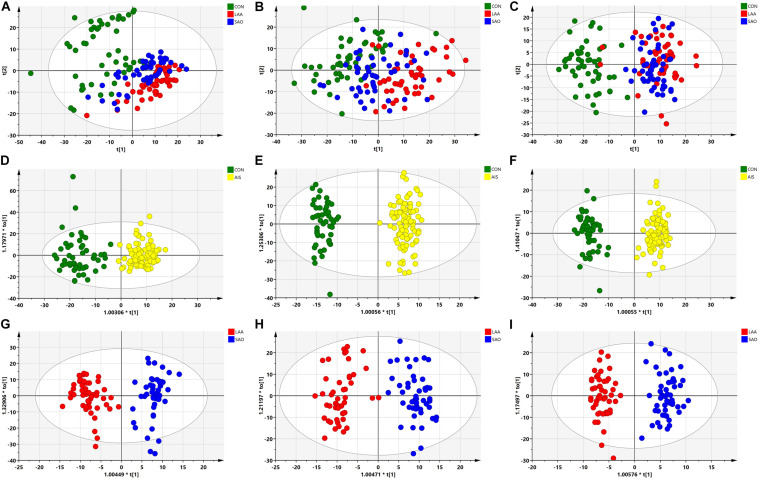
FIGURE 1.
Multivariate statistical analysis of serum metabolic profiling between acute ischemic stroke (AIS) and healthy control (HC) groups. (A) Principal component analysis (PCA) score plots in the C18-positive column (R2X = 0.789, Q2 = 0.547). (B) PCA score plots in the C18-negative column (R2X = 0.817, Q2 = 0.616). (C) PCA score plots in the Hydrop interaction liquid chromatography (HILIC) column (R2X = 0.732, Q2 = 0.453). (D) Orthogonal projections to latent structures—discriminant analysis (OPLS-DA) score plots of patients with AIS and HCs in the C18-positive column (R2Y = 0.883, Q2 = 0.726). (E) OPLS-DA score plots of patients with AIS and HCs in the C18-negative column (R2Y = 0.964, Q2 = 0.857). (F) OPLS-DA score plots of the patients with AIS and HCs in the HILIC column (R2Y = 0.985, Q2 = 0.914). (G) OPLS-DA score plots of the large artery atherosclerosis (LAA) and the small artery occlusion (SAO) groups in the C18-positive column (R2Y = 0.916, Q2 = 0.778). (H) OPLS-DA score plots of the LAA and the SAO groups in the C18-negative column (R2Y = 0.909, Q2 = 0.800). (I) OPLS-DA score plots of the LAA and the SAO groups in the HILIC column (R2Y = 0.953, Q2 = 0.726).

