FIGURE 4.
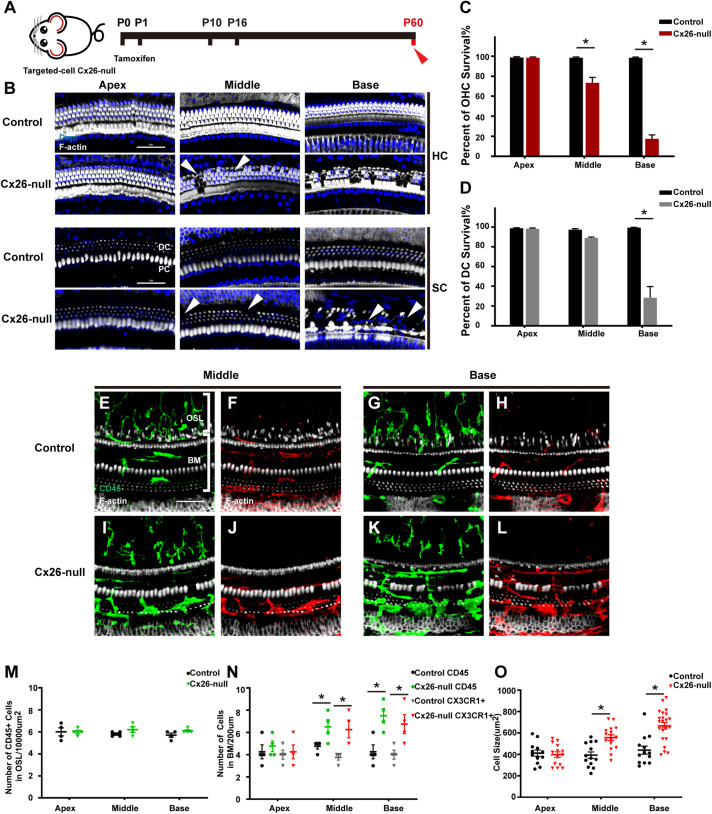
Cell degeneration pattern and distribution of macrophages in the targeted-cell Cx26-null mouse model at P60. (A) Targeted-cell Cx26-null mice were sacrificed at P60. (B) Representative images of OHCs and DCs (F-actin, white) in different regions from the control and Cx26-null groups. White arrowheads indicate the absence of OHCs or DCs in the middle or basal cochlea of the Cx26-null group. (C,D) Quantifications of OHC (C) or DC (D) survival from different groups. (E–H) Double labeling of immune cells with CD45 (green) and CX3CR1 (red) in the middle (E,F) and basal (G,H) cochleae of the control group. (I–J) Double labeling of immune cells with CD45 (green) and CX3CR1 (red) in the middle (I,J) and basal (K,L) regions of the Cx26-null group. (M) Comparison of the numbers of CD45+ cells in the OSL between the control and Cx26-null groups. (N) Comparison of the numbers of CD45+ and CX3CR1+ cells in the BM between the control and Cx26-null groups. (O) Quantification of macrophage size in different turns from the control and Cx26-null groups. The scales in (B,E) represent 50 μm. *Significant difference from the control group (p < 0.05).

