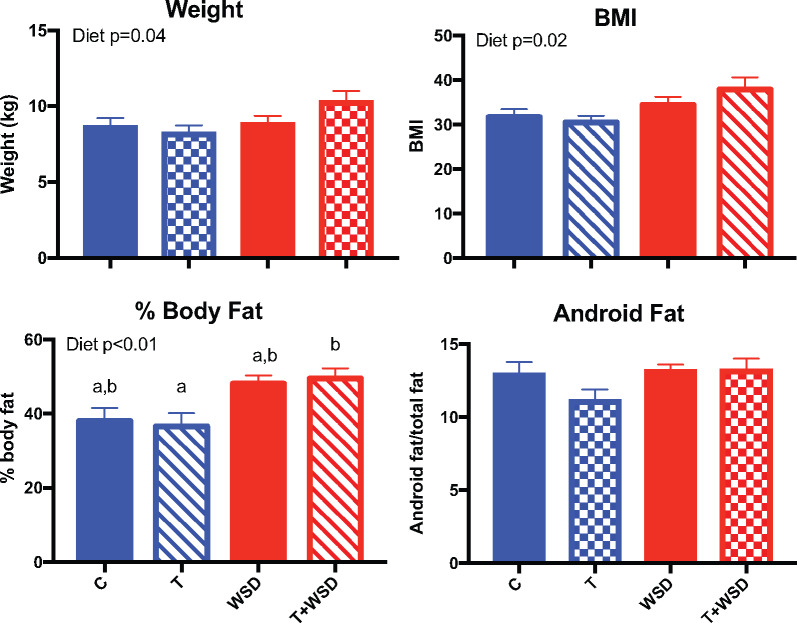
Figure 1.
Effects of T, WSD and T + WSD treatment on body composition after 5 years of continuous exposure. Body weight (kg) was measured, along with crown-rump measurement for BMI calculation (BW/(CR)2) under sedation, followed by a double X-ray absorptiometry scan to assess the % body fat and the amount of fat coming from the android region. Data are presented as means ± SEM (C n = 10, T n = 9, WSD n = 9 and T + WSD n = 8). Significant effects (P < 0.05) of WSD and/or T, or interactions over time, as determined by linear models ANOVA are presented as text within the graphs. Different letters signify significant group differences as determined by Tukey–Kramer post hoc analysis. C, Control; T, testosterone; WSD, Western-style diet.

