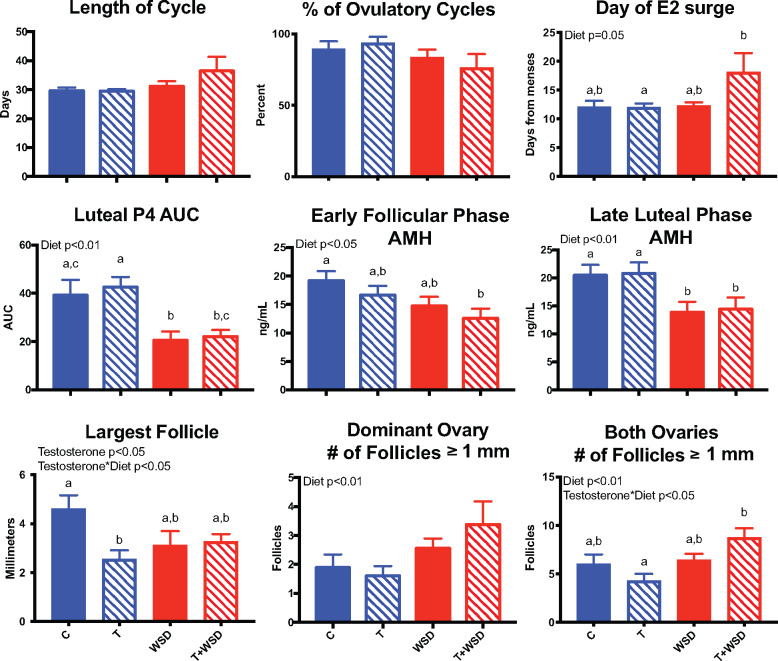
Figure 3.
Reproductive function after 5 years of exposure to chronic T and/or WSD. The average length of cycle and percent ovulatory cycles were analyzed during Year 5 of treatment as detailed in Materials and Methods (C, T, WSD n = 10; T + WSD n = 9). At ∼5.8 months post-partum, females underwent more detailed analyses during one randomly chosen menstrual cycle (C n = 9, T, WSD n = 10 and T + WSD n = 8). Data are presented as means SEM. Significant effects (P < 0.05) of WSD and/or T or interactions between these treatments determined by linear models ANOVA are presented as text within the graphs. Different letters signify significant group differences as determined by Tukey–Kramer post hoc analysis. C, Control; T, testosterone; WSD, Western-style diet.

