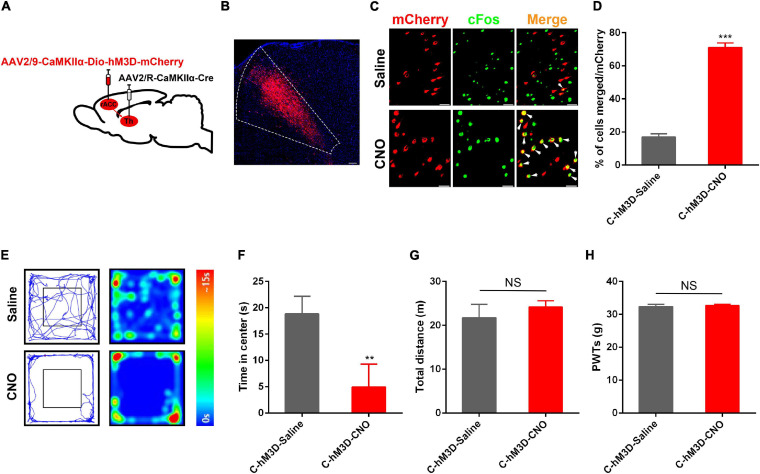
FIGURE 3.
Anxiety disorders induced by specific activation of the rACC glutamatergic output to the thalamus in control rats. (A) Scheme showing configuration of the experiment. (B) The representative images of the whole rACC after virus injections. (C) Representative images of CaMKIIα-positive neurons (red) merged with c-Fos (green) in rats expressing the hM3D in the rACC (scale bars: 20 μm). (D) Percentage of total CaMKIIα co-expressing c-Fos in different groups (n = 4–5 rats per group). (E) Representative animal tracks from rats treated with saline/CNO at 43 days in the open field test. (F) Time in the center for rats treated with saline/CNO at 43 days in the OFT (n = 7 in the C-hM3D-Saline group; n = 11 in the C-hM3D-CNO group). (G) Total distance of rats treated with saline/CNO at 43 days in the OFT (n = 7 in the C-hM3D-Saline group; n = 11 in the C-hM3D-CNO group). (H) Paw withdrawal threshold in response to von Frey filaments (n = 11 in the C-hM3D-Saline group; n = 11 in the C-hM3D-CNO group). Data are presented as the mean ± SEM. **p < 0.01, ***p < 0.001 vs. C-hM3D-Saline group; NS, not significant.

