
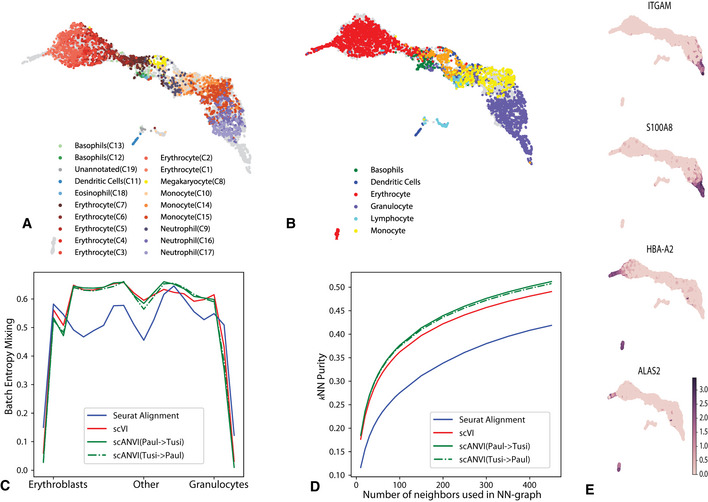
Figure 4. Harmonizing developmental trajectories.
-
A, BUMAP visualization of the scVI latent space, with cells colored by the original labels from either the HEMATO‐Paul (A) or HEMATO‐Tusi (B) studies. The cells from the other dataset are colored in gray.
-
CEntropy of batch mixing along 20 bins of the HEMATO‐Tusi cells, ordered by the potential of each cell. Potential is a pseudotime measure that describes the differentiation state of a cell using the population balance analysis algorithm (center: common myeloid progenitors; moving left: erythrocyte branch; moving right: granulocyte branch).
-
Dk‐nearest neighbors purity for scVI, Seurat, and scANVI.
-
EExpression of marker genes that help determine the identity of batch‐unique cells.