
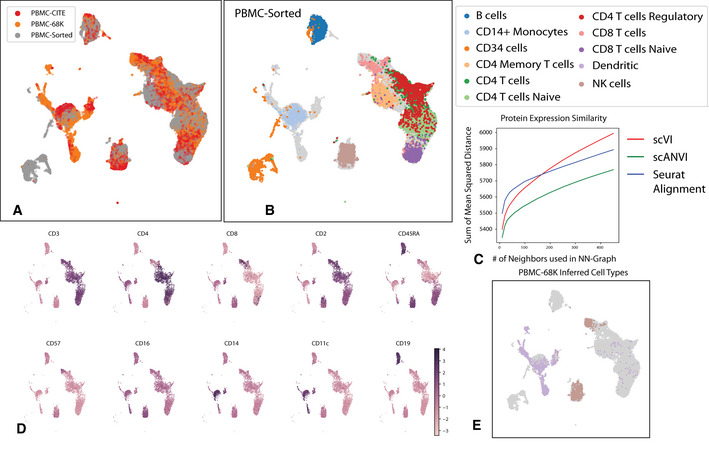
Figure 5. Validation of cell type annotations using additional metadata.
-
A, BUMAP plot of the scANVI latent space inferred for three harmonized datasets: PBMC‐CITE, PBMC‐sorted, and PBMC‐68K. Cells are colored by the dataset of origin (A) and the PBMC‐sorted labels (B). Cells from the PBMC‐CITE and PBMC‐68K are colored in gray in (B).
-
CThe consistency of the harmonized PBMC‐CITE mRNA data with the respective protein measurements, evaluated by mean squared error and for different neighborhood size. Lower values indicate higher consistency.
-
DUMAP plot of the scANVI latent space, where cells are colored by normalized protein measurement. Only PBMC‐CITE cells are displayed.
-
EUMAP plot of the scANVI latent space, with cells from the PBMC‐68k dataset colored according to their original label. For clarity of presentation, only cells originally labeled as dendritic cells or natural killer cells are colored. Evidently, a large number of these cells are mapped to a cluster of T cells (right side of the plot).