
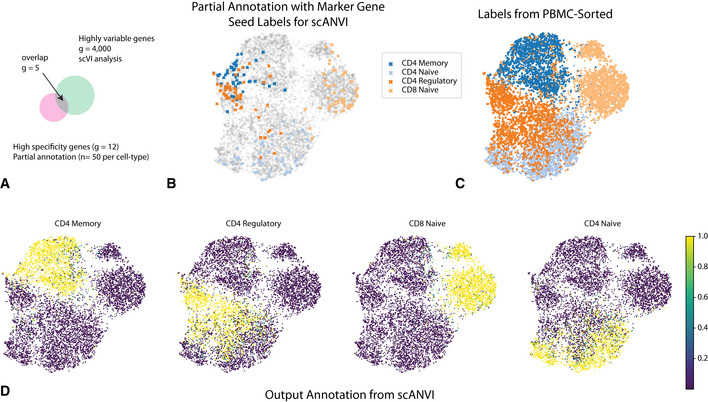
Figure 6. Cell type annotation in a single dataset using “seed” labeling.
-
ADiscrepancies between marker genes that can be used to confidently label cells and highly variable genes in scRNA‐seq analysis.
-
B–DUMAP plot of the scVI latent space. (B) Seed cells are colored by their annotation (using known marker genes). (C) PBMC‐sorted cell type labels from the original study based on marker‐based sorting. (D) The posterior probability of each cell being one of the four T cell subtypes obtained with scANVI.