
Figure 7. Differential Expression on multiple datasets with scVI.
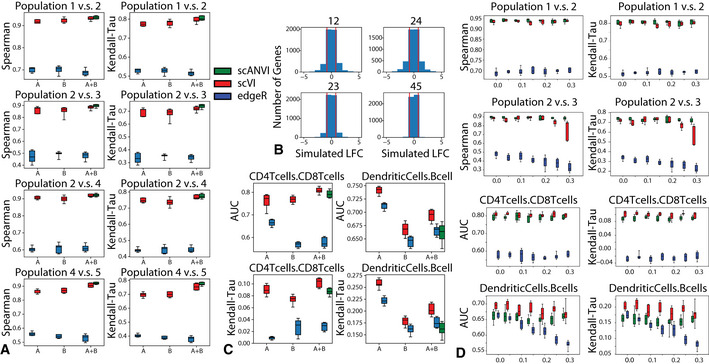
- Evaluation of consistency with Spearman rank correlation and Kendall‐Tau is shown for comparisons of multiple pairs of cell types in the simulated data. For each comparison, we subsampled 30 cells from each group, and repeated the subsampling 10 times to evaluate the uncertainty in our result.
- Distribution of true log fold change between all pairs of cell types for the simulated data. The pairs of cells are chosen to represent different levels of distance on the tree as in Appendix Fig S18A. The pairs of population from most distant to least distant are “12”, “24”, “23”, “45”.
- Evaluation of consistency with the AUROC and Kendal Tau metric is shown for comparisons of CD4 vs CD8 T cells and B cells vs dendritic cells on the PBMC‐8K only (A), the PBMC‐68k only (B) and the merged PBMC‐8K / PBMC‐68K (A + B) for scVI and edgeR. For each comparison, we subsampled 30 cells from each group, and repeated the subsampling 10 times to evaluate the uncertainty in our result.
- Mislabeling experiment in differential expression in both the SymSim simulated datasets and in the PBMC8K and PBMC68K dataset. The top row shows differential expression results for the correctly labeled population pair (Population 1 vs. Population 2 in simulated dataset and CD4 T cells vs. CD8 T cells in PBMC dataset. The bottom row shows differential expression results for the mislabelled population pair (Population 2 vs. Population 3 in simulated dataset and dendritic cells vs. B cells in PBMC dataset). For all, x‐axis represents the proportion of flipped labels.
Data information: The boxplots are standard Tukey boxplots where the box is delineated by the first and third quartile and the whisker lines are the first and third quartile plus minus 1.5 times the box height. The dots are outliers that fall above or below the whisker lines. The center band indicates the median.