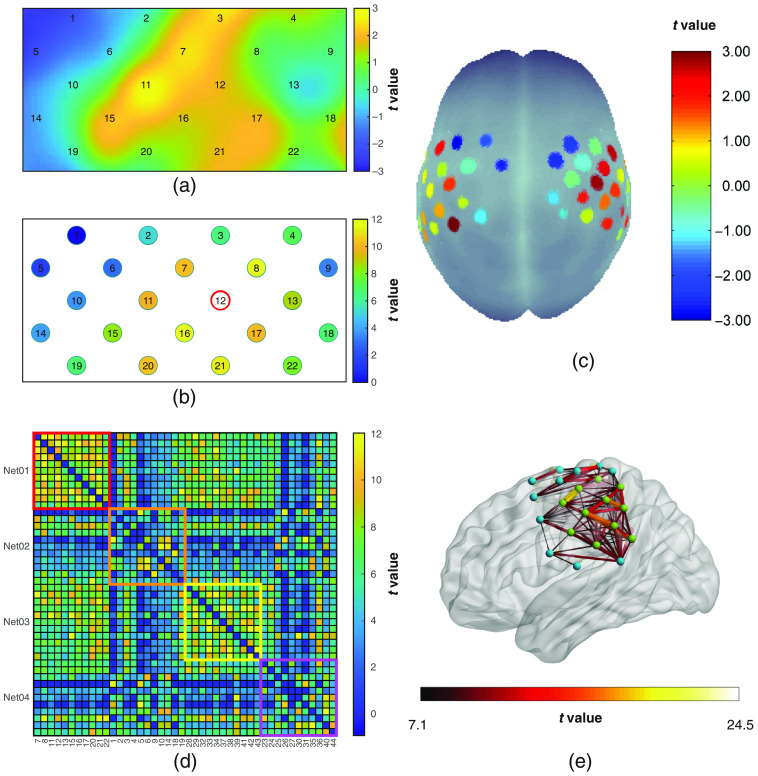
Fig. 9.
Examples of visualization for resting-state analysis results: (a) group-level zfALFF map (interpolation mode); (b) ROI2Whole FC map (non-interpolation mode, and channel 12 is the seed channel); (c) non-interpolated channel-wise 3D visualization for group-level zfALFF result using the NFRI toolbox; (d) 2D whole brain FC matrix map; and (e) 3D visualization of whole brain connectivity matrix by BrainNet Viewer using the node and edge files generated by NIRS-KIT. Note: All above color bars represent group-level () one-sample -test statistical values, and the color axis limits are set for illustration only. In A and B panels, only the left hemisphere probe (channels 1 to 22) is displayed to reduce clutter.

