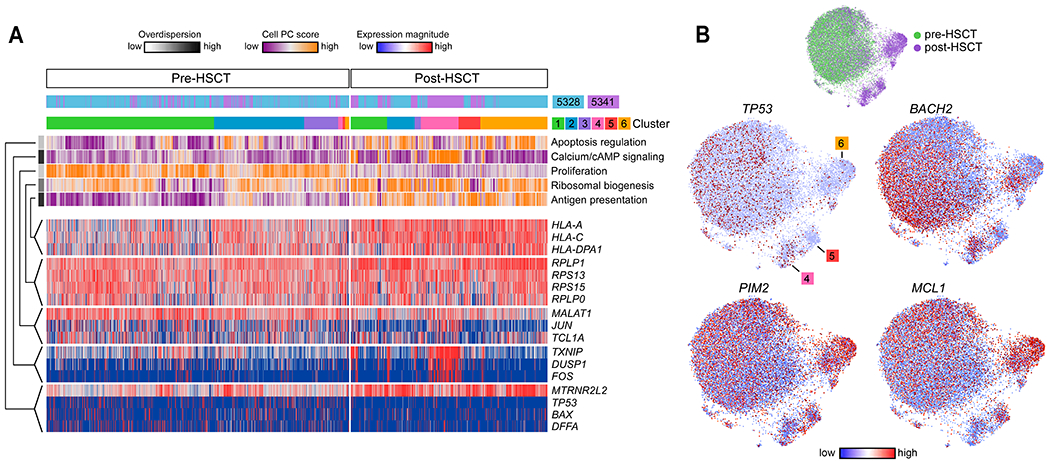
Fig. 3. Transcriptional programs define inter- and intra-leukemic heterogeneity during late relapse.

(A) Cells (columns) from patients 5328 and 5341 are organized by cluster assignment. For each cell, relapse kinetics, timing and principal component (PC)/aspect score are displayed. For each aspect, overdispersion score is shown by white/black color bar. Row labels summarize key functional annotations of gene sets for each aspect. For each aspect, gene expression patterns of top-loading genes are shown. (B) Joint graphs of CLL cells are visualized to demonstrate differential downregulation of tumor suppressor genes (TP53 and BACH2) and differential upregulation of oncogenic signalling (PIM2, MCL1) after allo-HSCT among late relapse clusters 4, 5 and 6.
