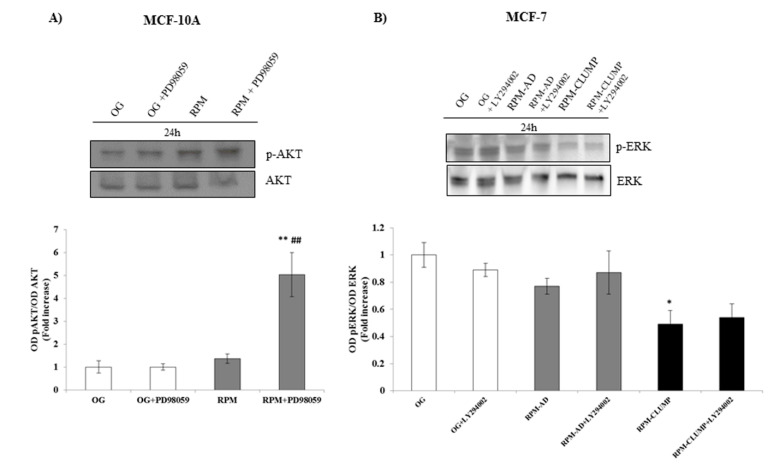
Figure 13.
Immunoblot bar chart showing the expression of the p-AKT/AKT ratio and p-ERK/ERK ratio in MCF-10A (A) and MCF-7 (B) in on-ground control cells, RPM adherent cells, and RPM cell clumps at 24 h w/o the p-ERK inhibitor. PD89059, and w/o the p-AKT inhibitor, LY294002, respectively. Columns and bars represent densitometric quantification of the optical density (OD) of the p-AKT and p-ERK signal normalized with the OD values of AKT and ERK serving as the loading control. Each column represents the mean value ± SD of three independent experiments. * p < 0.05, ** p < 0.01 vs. OG; ## p < 0.01 vs. RPM by ANOVA followed by Bonferroni post-test.

