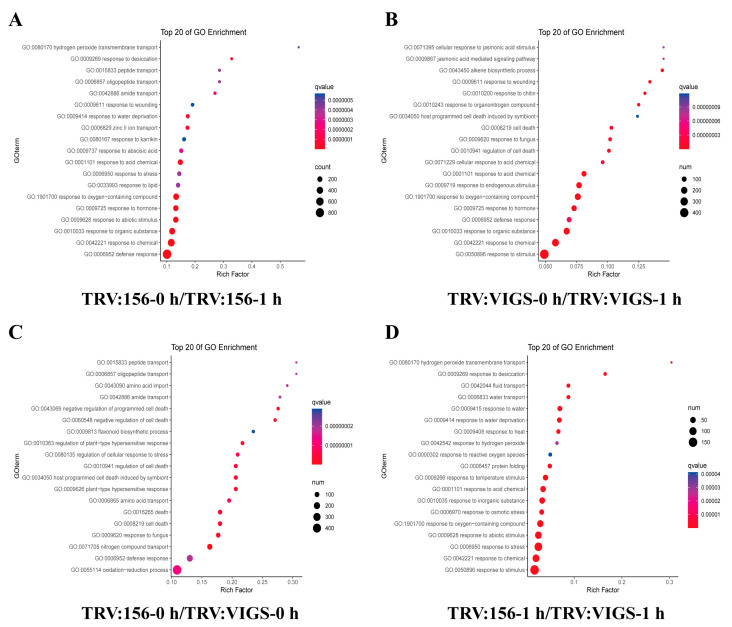
Figure 7.
Gene ontology (GO) enrichment analysis. (A) GO terms of TRV:156-0 h/TRV:156-1 h (B) GO terms of TRV:VIGS-0 h/TRV:VIGS-1 h (C) GO terms of TRV:156-0 h/TRV:VIGS-0 h (D) GO terms of TRV:156-1 h/TRV:VIGS-1 h. Each circle in the figure represents a GO biological process, and the number of genes enriched in a pathway corresponds to the size of the circle. The degree of significance of the enrichment of DEGs in a pathway is represented by qvalue. The abscissa indicates the ratio of the number of DEGs annotated to a particular GO term to the number of the DEGs annotated to all GO terms.

