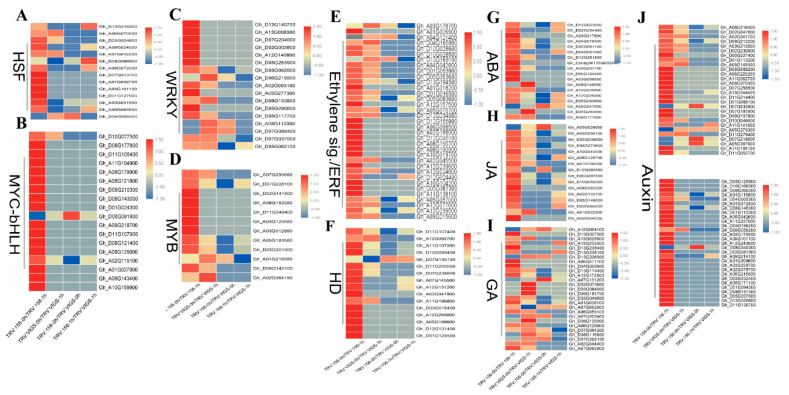
Figure 8.
Heat maps indicating expression comparison of hormones or transcription-factors among four comparison sets. (A) Heat shock transcription factor (HSF). (B) MYC-bHLH. (C) WRKY. (D) MYB. (E) Ethylene signaling and response-factors. (F) Homeobox domain transcription factors (TFs). (G) Abscisic acid (ABA). (H) Jasmonic acid (JA). (I) Gibberellic acid (GA). (J) Auxin. TBtools-software was used to construct heatmaps, Red color represents upregulation, and blue color represents downregulation.

