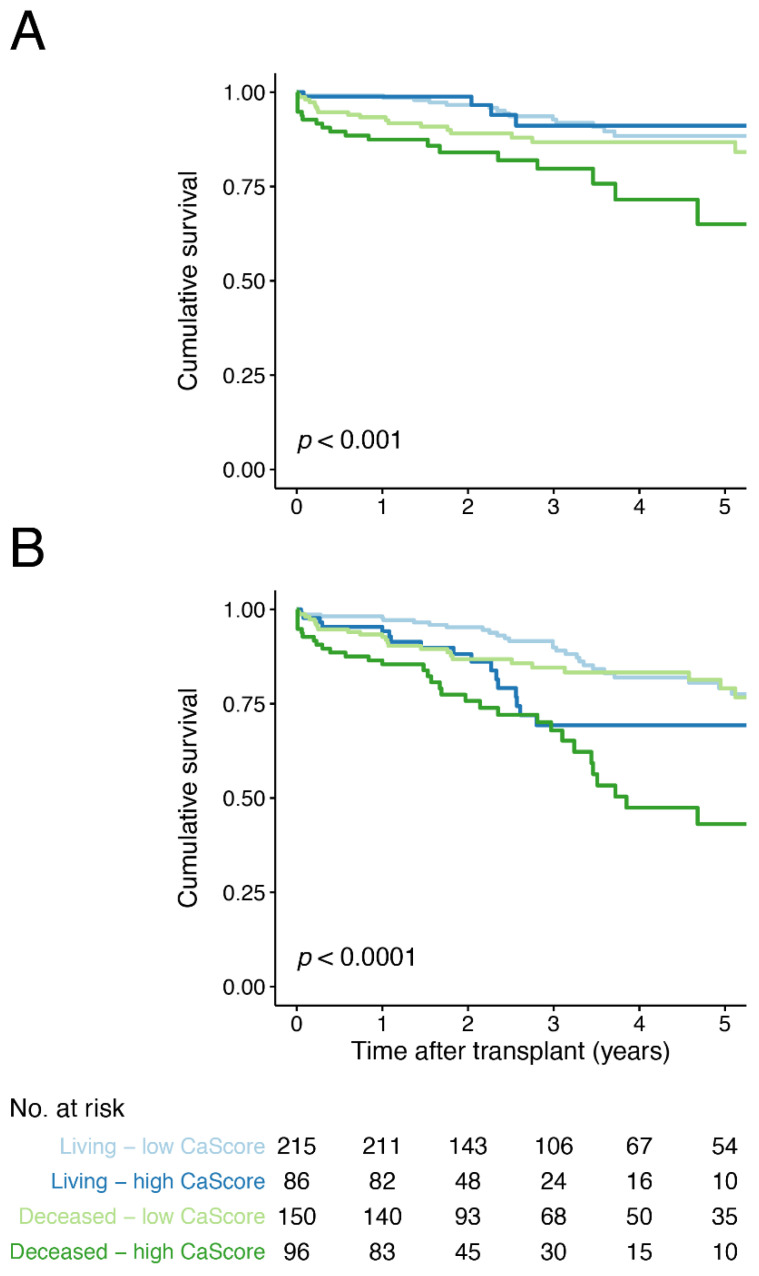
Figure 2.
Kaplan–Meier survival curve for (A) death-censored and (B) overall graft failure free-survival for the low and high aorto-iliac CaScore group, stratified by living and deceased donor kidney transplantation and including a life table applicable for both graphs. Number at risk (No. at risk) provided for all four groups.

