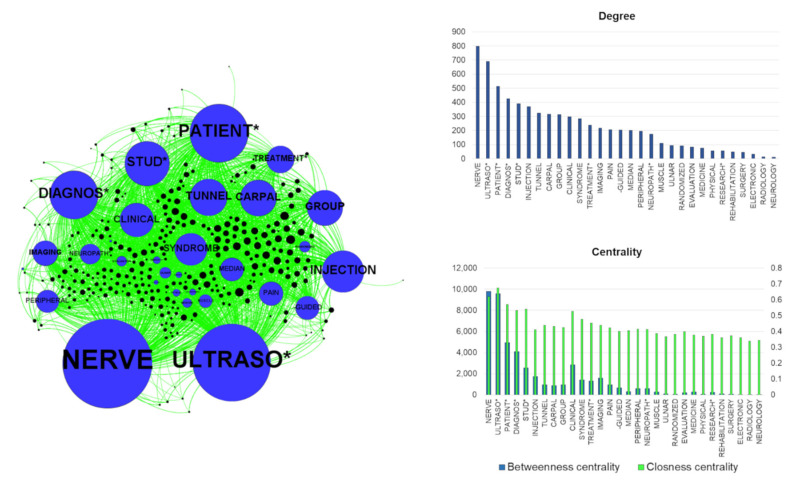
Figure 3.
On the left, the graph of the LENGTH method. The nodes (the circles) represent the words (blue) and the papers (black). The dimension of each node is related to the degree values, meaning the number of connections with papers and, hence, the frequency of citations of the words in the titles/abstracts. The edges (green) represent the connections between a word and the papers. The node distribution is based on the ForceAtlas2 algorithm. This algorithm distributes the nodes depending on their connections; closer nodes are more connected. On the right part of the figure, the histograms indicate the values of degree, betweenness and closeness centrality of the word nodes. The asterisks represent different final parts of words (for example, ultraso* may indicate ultrasound, ultrasonography, etc.).

