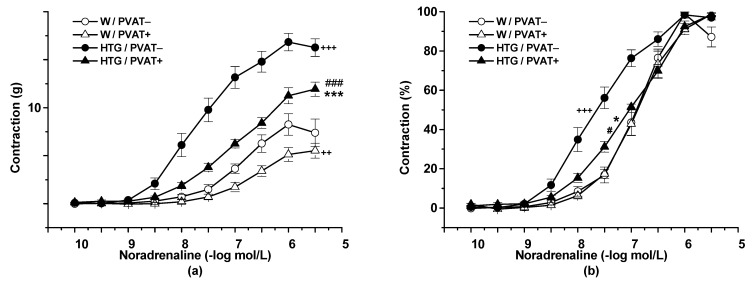
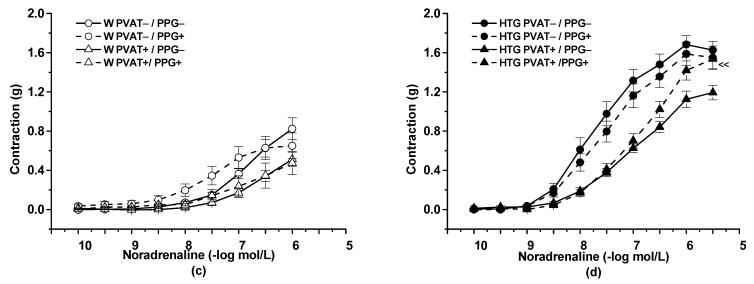
Figure 2.
Noradrenaline-induced contractile response of the thoracic aorta of normotensive Wistar rats (W, n = 8) and hypertriglyceridemic rats (HTG, n = 9) with intact (PVAT+) or removed (PVAT−) perivascular adipose tissue expressed as the active wall tension (a) and as percentages of the maximal reached response induced by noradrenaline (b) before (PPG−) and after (PPG+) pretreatment with propargylglycine (c,d). The results are presented as the mean ± S.E.M, and differences between groups were analyzed by three-way ANOVA with the Bonferroni post hoc test on ranks. * p < 0.05 vs. W/PVAT+; *** p < 0.001 vs. W/PVAT+; +++ p < 0.001 vs. W/PVAT−; ++ p < 0.01 vs. W/PVAT−; # p < 0.001 vs. HTG/PVAT−; ### p < 0.001 vs. HTG/PVAT−; << p < 0.01 vs. HTG PVAT+/PPG−.


