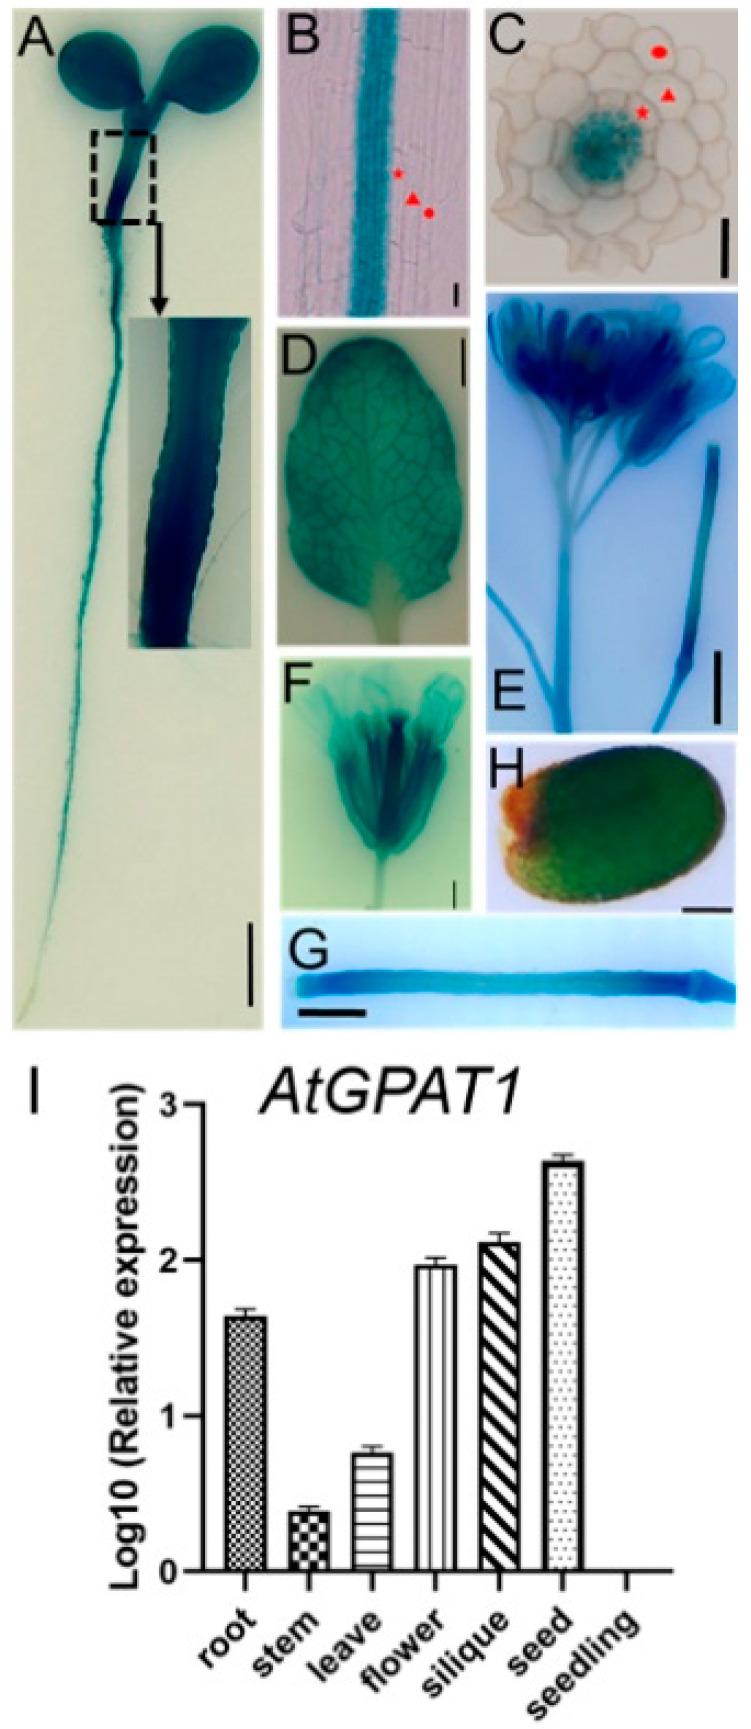
Figure 1.
Analysis of GPAT1 expression in Arabidopsis wild-type plants. (A–H) Expression analysis of GPAT1 by ProGPAT1-GUS. (A) GUS staining in a five-day-old seedling grown on agar. Bar = 10 mm. (B,C) GUS staining in roots of seven-day-old seedlings grown on agar. The red solid circle, triangle and pentagram indicated the epidermis, cortex and endodermis, respectively. Bar = 20 μm. (D) GUS staining in rosette leaves. Bar = 10 mm. (E) GUS staining in inflorescences and inflorescence stems. Bar = 2 mm. (F) GUS staining in flowers. Bar = 1 mm. (G) GUS staining in 4-DAP siliques. DAP, day after pollination. Bar = 1 mm. (H) GUS staining in mature seeds. Bar = 100 μm. (I) Expression profiles of GPAT1 in different tissues of WT plants. Total RNA was extracted from different tissues of soil-grown plants for qRT-PCR. Values were standardized using the Arabidopsis Actin 2 gene. Values are the means of three independent experiments ± standard error (SE) (n = 3).

