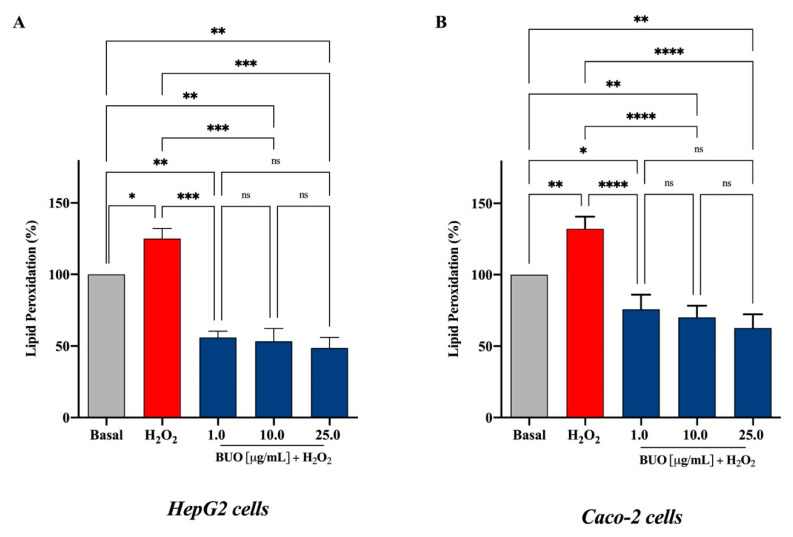
Figure 4.
Evaluation of the effects of the BUO extract on H2O2-induced lipid peroxidation levels in human hepatic HepG2 cells (A) and intestinal Caco-2 cells (B) as assessed by intracellular MDA levels. The data points represent the averages ± SD of six independent experiments in duplicate. All data sets were analyzed by One-way ANOVA followed by Tukey’s post-hoc test. ns: not significant; (*) p < 0.5, (**) p < 0.01, (***) p < 0.001, (****) p < 0.0001. Basal: untreated cells.

