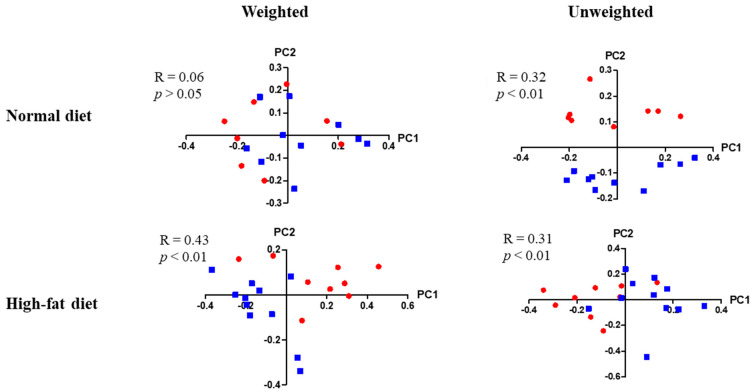
Figure 7.
Enteric bacterial populations in young male KO and WT mice. Red circles indicate KO mice, whereas blue squares indicate WT mice. For mice fed a normal diet, n = 8 KO mice, and n = 10 WT mice. For mice fed a high-fat diet, n = 9 KO mice, and n = 11 WT mice. Correlation coefficients and p-values are shown in the figure.

