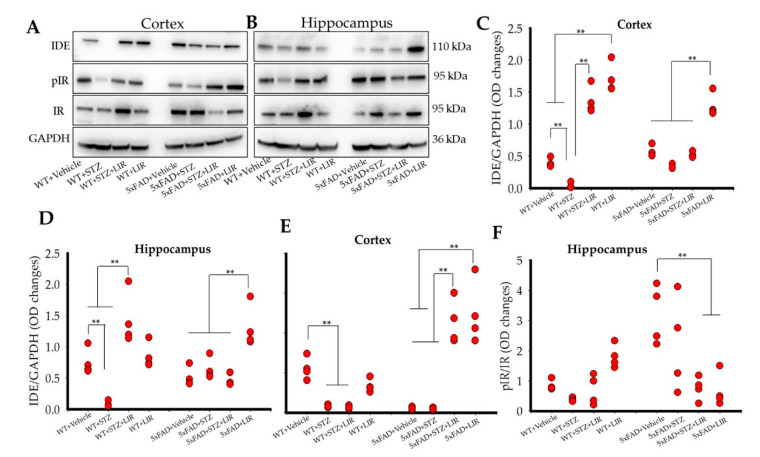
Figure 5.
Insulin-Degrading Enzyme and Phosphorylated Insulin Receptor protein levels in the cortical and hippocampal regions of the WT and 5xFAD mice. Following LIR treatment, WT and 5xFAD mice (n = 3 from each group) were sacrificed via cervical dislocation and their brains were immediately collected and homogenized for Western blot analysis. (A,B): Representative Western blot bands for IDE, pIR, and IR in both cortical and hippocampal regions of WT and 5xFAD mice. (C,D): Histograms showing densitometric quantification of IDE, normalized with GAPDH, in the cortex and hippocampal regions of the brain, respectively. (E,F): Histograms showing densitometric quantification of pIR normalized with GAPDH and IR in the cortex and hippocampal regions of the brain, respectively. ** p < 0.01.

