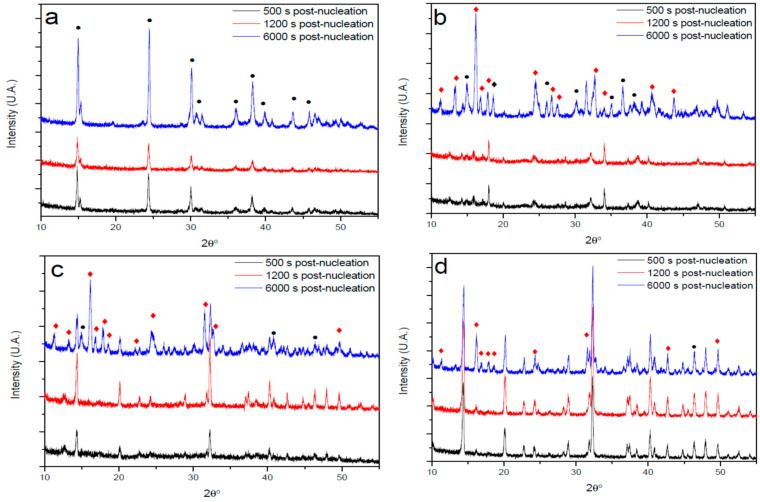
Figure 5.
XRD patterns of CaOx particles obtained via titration experiments in the absence (control) and in the presence of PAA in the post-nucleation stage at 500, 1200 and 6000 s. (a) control, (b) with 10 mg/L PAA, (c) with 50 mg/L PAA, (d) with 100 mg/L PAA. The symbols of •, □ and ♦ indicate COM, COD and COT, respectively.

