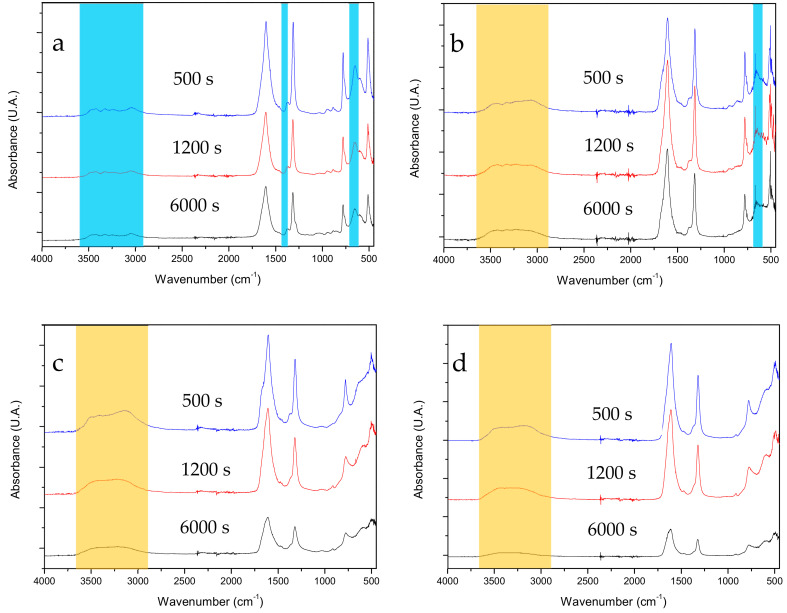
Figure 6.
FTIR spectra of CaOx particles obtained in post-nucleation stage at 500, 1200 and 6000 s. (a) without PAA, (b) with 10 mg/L PAA, (c) with 50 mg/L PAA, (d) with 100 mg/L PAA. Light blue and orange shaded bars indicate the characteristic absorption bands of COM and the absorption bands of coordinated water molecules in the COD and COT hydrates, respectively.

