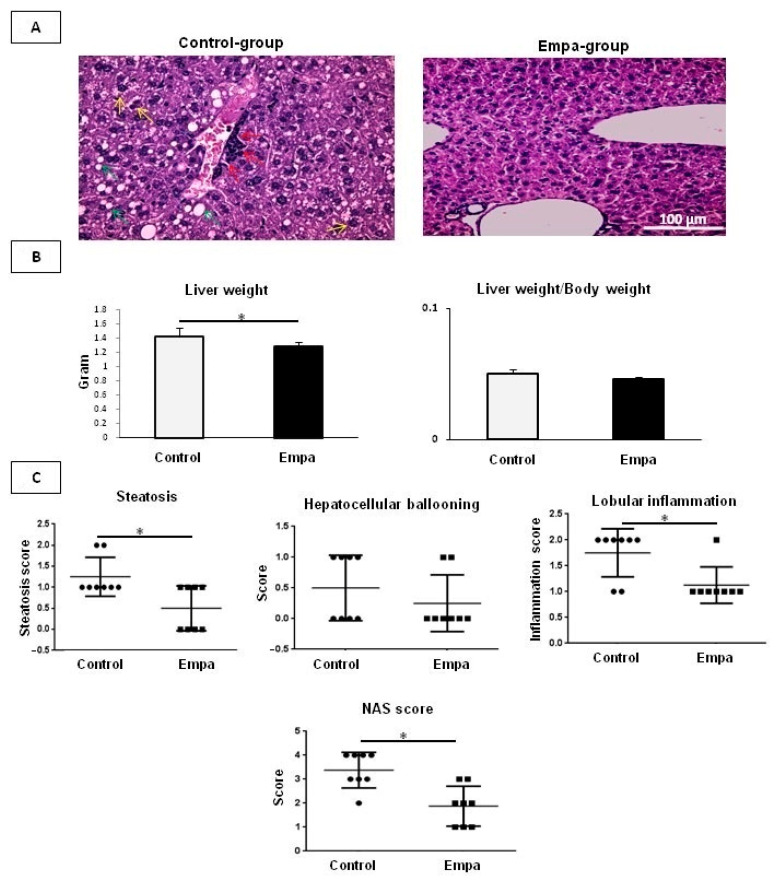
Figure 2.
Histological assessment of NAFLD/NASH severity. (A) Representative images of H&E-stained slides of ApoE(-/-) mice after five weeks of empagliflozin/vehicle oral administration. Lobular inflammation, ballooning cells and cytoplasmic lipid droplets are shown by red, yellow and green arrows, respectively. (B) The liver weight and the ratio of liver weight to body weight. (C) Histological evaluation of steatosis, hepatocellular ballooning, lobular inflammation and NAS score. Data are shown as the mean ± SD (*: p < 0.05).

