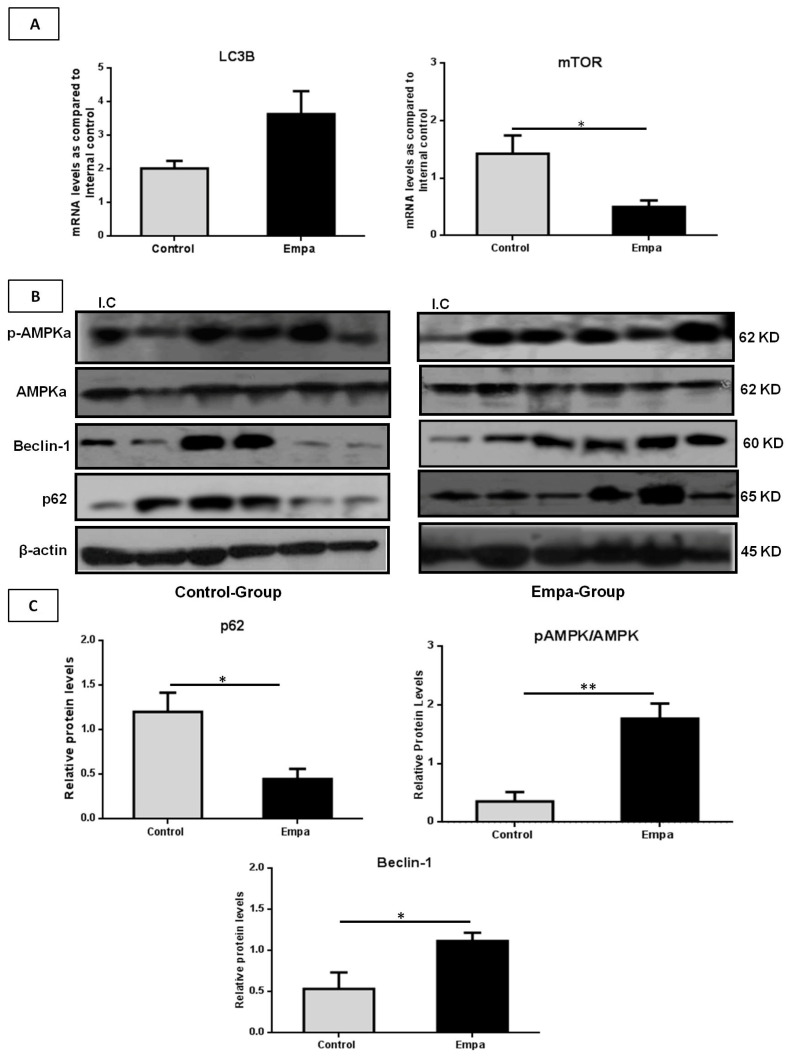
Figure 6.
The mRNA and protein expression profiles of the autophagy-related genes. (A) Relative mRNA levels of LC3B was increased while the mTOR mRNA expression was reduced after five weeks of empagliflozin administration. (B) Western blot analysis of p62, Beclin-1, total AMPKa and phospho-AMPKa in liver tissues. (C) Quantitative analyses showed that empagliflozin reduces p62, while it increases the p-AMPKa/AMPKa ratio and Beclin-1 protein levels. Data are shown as the mean ± SEM (*: p < 0.05; **: p < 0.01; I.C: Internal control).

